Fraud Blocker Skip to main content

Analytical Collection

"Unveiling the Hidden World: Exploring Analytical Techniques and Visionaries" Step into the realm science, where mysteries are unraveled and secrets are revealed

Background imageAnalytical Collection: Mass spectrometer, 1954

Mass spectrometer, 1954
Mass spectrometer. Researchers adjusting the controls of a mass spectrometer. This is an all-metal demountable mass spectrometer

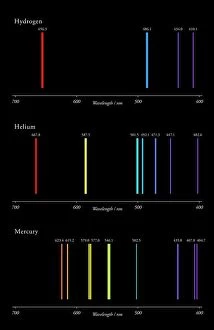
Background imageAnalytical Collection: H-He-Hg emission spectra C017 / 7260

H-He-Hg emission spectra C017 / 7260
H-He-Hg emission spectra. Graphical representation of the emission spectra lines for the elements hydrogen (H), helium (He) and mercury (Hg)

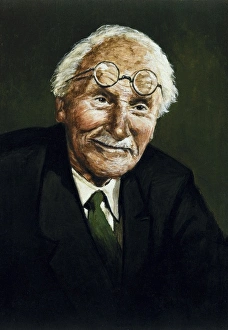
Background imageAnalytical Collection: JUNG, Carl Gustav (1875-1961). Swiss psychiatrist

JUNG, Carl Gustav (1875-1961). Swiss psychiatrist and psychologist. Founder of analytical psychology. Oil

Background imageAnalytical Collection: Electrophoresis of RNA

Electrophoresis of RNA
Liver RNA. Electrophoresis gel containing RNA (ribonucleic acid) isolated from liver tissue. The RNA molecules (white bands) are being observed under ultraviolet light

Background imageAnalytical Collection: The late Mr. John Nesbit, Professor of Chemistry and Principal of Kennington Agricultural... 1862

The late Mr. John Nesbit, Professor of Chemistry and Principal of Kennington Agricultural... 1862. Creator: Unknown
The late Mr. John Nesbit, Professor of Chemistry and Principal of Kennington Agricultural College, 1862....at the age of fifteen he made an electric-battery which was purchased by the Mechanics

Background imageAnalytical Collection: Carl Gustav Yung (b / w photo)

Carl Gustav Yung (b / w photo)
5999513 Carl Gustav Yung (b/w photo) by European Photographer, (19th century); Private Collection; (add.info.: Carl Gustav Yung (1875-1961).); © Look and Learn

Background imageAnalytical Collection: Martin Heinrich Klaproth (engraving)

Martin Heinrich Klaproth (engraving)
815850 Martin Heinrich Klaproth (engraving) by German School, (19th century); Private Collection; (add.info.: Martin Heinrich Klaproth (1743-1817)

Background imageAnalytical Collection: Chromatogram, 2D View

Chromatogram, 2D View
Chromatogram, 2D view of the output of a chromatography. Different peaks in the chromatogram correspond to different components of the examined sample

Background imageAnalytical Collection: The Painters March from Finchley, print by Paul Sandy, 1753 (engraving)

The Painters March from Finchley, print by Paul Sandy, 1753 (engraving)
XJF867792 The Painters March from Finchley, print by Paul Sandy, 1753 (engraving) by English School, (18th century); Private Collection; (add.info.: BM 1904, 0819.706); English, out of copyright

Background imageAnalytical Collection: Raman laser spectroscopy C016 / 3827

Raman laser spectroscopy C016 / 3827
Raman laser spectroscopy. Researcher observing laser beams and microscope objectives. This LabRAM HR Raman laser spectrometer is being used to obtain phase

Background imageAnalytical Collection: X-ray crystallography C016 / 3824

X-ray crystallography C016 / 3824
X-ray crystallography. Researcher using an X-ray machine to obtain crystal diffraction patterns of proteins for 3-D imaging of enzymes

Background imageAnalytical Collection: FE scanning electron microscopy C016 / 3821

FE scanning electron microscopy C016 / 3821
FE scanning electron microscopy. Researcher operating a field-emission scanning electron microscope (FE-SEM). This is a F JEOL 6320F FE-SEM

Background imageAnalytical Collection: Scanning transmission electron microscopy C016 / 3815

Scanning transmission electron microscopy C016 / 3815
Scanning transmission electron microscopy. Researcher using a scanning transmission electron microscope (STEM) to analyse the structure of solid-state materials

Background imageAnalytical Collection: Infrared spectrometer, 1954

Infrared spectrometer, 1954
Infrared spectrometer. Researcher using an infrared grating spectrometer. This is used to analyse the composition of chemicals by recording the wavelengths at which they absorb infrared radiation

Background imageAnalytical Collection: Sulphur flame test

Sulphur flame test. Sulphur burning in air, producing a blue flame. The colour of the flame is caused by electrons that have been excited to a higher energy state

Background imageAnalytical Collection: Illustration of mass spectrometry, an analytical technique identifying molecular mass of sample of

Illustration of mass spectrometry, an analytical technique identifying molecular mass of sample of charged particles

Background imageAnalytical Collection: Virgo is the sixth astrological sign of the Zodiac

Virgo is the sixth astrological sign of the Zodiac. Its symbol is the virgin or maiden

Background imageAnalytical Collection: DR. HENRY LETHEBY, (1816a'1876), analytical chemist and public health officer, was

DR. HENRY LETHEBY, (1816a'1876), analytical chemist and public health officer, was born at Plymouth in 1816, and studied chemistry at the Royal Cornwall Polytechnic Society, ENGRAVING 1876, UK

Background imageAnalytical Collection: DESCARTES MANUSCRIPT. Title-page of the first edition of Rene Descartes Discours de la Methode

DESCARTES MANUSCRIPT. Title-page of the first edition of Rene Descartes Discours de la Methode, Leyden, 1637. This fundamental work in philosophy and on the method of science

Background imageAnalytical Collection: One of Charles Babbages calculating engines. Wood engraving, 1864

One of Charles Babbages calculating engines. Wood engraving, 1864
BABBAGE CALCULATOR, 1864. One of Charles Babbages calculating engines. Wood engraving, 1864

Background imageAnalytical Collection: Joseph Louis Lagrange (1736-1813) French: analytical mathematics. From The Gallery of Portraits

Joseph Louis Lagrange (1736-1813) French: analytical mathematics. From The Gallery of Portraits, Charles Knight, London, 1833

Background imageAnalytical Collection: Charles Babbage (1791-1871) English mathematician. Difference engine for calculation of log tables

Charles Babbage (1791-1871) English mathematician. Difference engine for calculation of log tables, and Analytical engine. Wood engraving published London 1871

Background imageAnalytical Collection: Dr. Henry Letheby, (1816Aa

Dr. Henry Letheby, (1816Aa
Dr. Henry Letheby, (1816A

Background imageAnalytical Collection: Tablet computer showing a chromatogram F006 / 6302

Tablet computer showing a chromatogram F006 / 6302
Tablet computer showing conceptual artwork a3D view of the output of a chromatography. Different peaks in the chromatogram correspond to different components of the examined sample

Background imageAnalytical Collection: Urine diabetes test C014 / 1231

Urine diabetes test C014 / 1231
MODEL RELEASED. Urine diabetes test. Woman using a urine self-test for diabetes. This test detects the levels of glucose and ketone in the urine

Background imageAnalytical Collection: Titration, illustration C018 / 0912

Titration, illustration C018 / 0912
Titration, illustration. Titration is used to find the concentration of a known volume of solution by fully reacting it with a second solution of known concentration, measuring the volume required

Background imageAnalytical Collection: Bird egg white protein, molecular model

Bird egg white protein, molecular model. This is a deglycosylated form of the egg white glycoprotein avidin, obtained from a chicken (Gallus gallus)

Background imageAnalytical Collection: OSL dating research C017 / 9992

OSL dating research C017 / 9992
MODEL RELEASED. OSL dating research. Researcher Michael Myer at work in the OSL Laboratory, Innsbruck University, Innsbruck, Austria

Background imageAnalytical Collection: OSL dating research, sample plate C017 / 9997

OSL dating research, sample plate C017 / 9997
OSL dating research, sample plate. Optically stimulated luminescence (OSL) dating is a method of determining how long ago minerals were last exposed to daylight

Background imageAnalytical Collection: OSL dating research, analysis laser C018 / 0003

OSL dating research, analysis laser C018 / 0003
OSL dating research, close-up of the laser-based machinery (green light). Optically stimulated luminescence (OSL) dating is a method of determining how long ago minerals were last exposed to

Background imageAnalytical Collection: OSL dating research, sample plate C017 / 9996

OSL dating research, sample plate C017 / 9996
OSL dating research, sample plate being loaded with samples. Optically stimulated luminescence (OSL) dating is a method of determining how long ago minerals were last exposed to daylight

Background imageAnalytical Collection: OSL dating research C017 / 9993

OSL dating research C017 / 9993
MODEL RELEASED. OSL dating research. Researcher Michael Myer at work in the OSL Laboratory, Innsbruck University, Innsbruck, Austria

Background imageAnalytical Collection: OSL dating research C017 / 9994

OSL dating research C017 / 9994
MODEL RELEASED. OSL dating research. Researcher Michael Myer at work in the OSL Laboratory, Innsbruck University, Innsbruck, Austria

Background imageAnalytical Collection: OSL dating research, sample plate C017 / 9998

OSL dating research, sample plate C017 / 9998
OSL dating research, close-up of a sample plate loaded with samples. Optically stimulated luminescence (OSL) dating is a method of determining how long ago minerals were last exposed to daylight

Background imageAnalytical Collection: OSL dating research laboratory C017 / 9995

OSL dating research laboratory C017 / 9995
OSL dating research laboratory. Optically stimulated luminescence (OSL) dating is a method of determining how long ago minerals were last exposed to daylight

Background imageAnalytical Collection: OSL dating research, analysis laser C018 / 0002

OSL dating research, analysis laser C018 / 0002
OSL dating research, close-up of the laser-based machinery (green light). Optically stimulated luminescence (OSL) dating is a method of determining how long ago minerals were last exposed to

Background imageAnalytical Collection: OSL dating research, analysis laser C018 / 0001

OSL dating research, analysis laser C018 / 0001
OSL dating research, close-up of the laser-based machinery (green light). Optically stimulated luminescence (OSL) dating is a method of determining how long ago minerals were last exposed to

Background imageAnalytical Collection: OSL dating research, analysis machine C017 / 9999

OSL dating research, analysis machine C017 / 9999
OSL dating research, analysis machine using lasers (green light). Optically stimulated luminescence (OSL) dating is a method of determining how long ago minerals were last exposed to daylight

Background imageAnalytical Collection: Genetic microarray, analysis machine C019 / 0282

Genetic microarray, analysis machine C019 / 0282
Genetic microarray, analysis machine. Analyst placing a prepared gene chip or microarray into an analysis machine. Samples of DNA (deoxyribonucleic acid) have been added to the microarray

Background imageAnalytical Collection: Genetic microarray, analysis machine C019 / 0281

Genetic microarray, analysis machine C019 / 0281
MODEL RELEASED. Genetic microarray, analysis machine. Analyst placing a prepared gene chip or microarray into an analysis machine

Background imageAnalytical Collection: Fingerprint analysis, 1918 C014 / 0458

Fingerprint analysis, 1918 C014 / 0458
Fingerprint analysis. Early 20th-century analysis of fingerprints, with a clerk using a loupe to examine the records. The ridges on the skin of human fingertips, a distinct and unique pattern

Background imageAnalytical Collection: Micrography metallurgy analysis, 1937 C014 / 0466

Micrography metallurgy analysis, 1937 C014 / 0466
Micrography metallurgy analysis. Researcher in the 1930s using a new photomicrograph design (right) to analyse the structural effect of corrosion on metals (left) used in aircraft construction

Background imageAnalytical Collection: Urine diabetes test C014 / 1230

Urine diabetes test C014 / 1230
MODEL RELEASED. Urine diabetes test. Woman using a urine self-test for diabetes. This test detects the levels of glucose and ketone in the urine

Background imageAnalytical Collection: Brent Dalrymple, US geologist

Brent Dalrymple, US geologist
Brent Dalrymple (born 1937), US geologist. Dalrymple is adjusting a mass spectrometer vacuum flight tube. Mass spectrometers accurately detect the mass of molecules of a sample

Background imageAnalytical Collection: Marine fuel analysis

Marine fuel analysis. Industrial researcher carrying out a calibration test on a hydrogen sulphide (H2S) analysis machine (vapour phase processor, VPP)

Background imageAnalytical Collection: Lab on a chip, LOCAD-PTS system C016 / 4199

Lab on a chip, LOCAD-PTS system C016 / 4199
Lab on a chip being held in a gloved hand. These devices are used for numerous applications, from medical tests to water quality monitoring to detecting the signatures of life on other planets

Background imageAnalytical Collection: Rutherford backscattering spectrometer C016 / 3834

Rutherford backscattering spectrometer C016 / 3834
Rutherford backscattering spectrometer chamber. This is a view of the inside of one of the chambers of the spectrometer. Rutherford backscattering spectroscopy (RBS)

Background imageAnalytical Collection: Nuclear magnetic resonance spectrometer C016 / 3830

Nuclear magnetic resonance spectrometer C016 / 3830
Nuclear magnetic resonance (NMR) spectrometer. NMR spectroscopy measures the resonance between an applied magnetic field and the magnetic moment of a molecules atoms


All Professionally Made to Order for Quick Shipping

"Unveiling the Hidden World: Exploring Analytical Techniques and Visionaries" Step into the realm science, where mysteries are unraveled and secrets are revealed. In 1954, a groundbreaking invention emerged - the mass spectrometer. This marvel of technology allowed scientists to delve deep into matter, deciphering its composition with unprecedented precision. As we journey further, we encounter the mesmerizing H-He-Hg emission spectra C017 / 7260. These ethereal patterns of light unveil the unique signatures of elements, guiding us towards a deeper understanding of their properties. In this captivating exploration, we stumble upon Carl Gustav Jung - a visionary Swiss psychiatrist whose profound insights transformed psychology forever. His work delved into the depths of human consciousness, shedding light on our innermost thoughts and emotions. Electrophoresis of RNA takes center stage as we witness molecules dancing through an electric field. This technique enables scientists to separate and analyze genetic material with astonishing accuracy, unraveling intricate biological puzzles. Venturing further still, we encounter acid soil - nature's enigma that affects plant growth and agricultural productivity. Through meticulous analysis using chromatography in both 3D and 2D views, researchers unlock vital clues about soil composition and nutrient availability. Amidst these scientific wonders lies Carl Gustav Yung's enigmatic black-and-white portrait. A man who explored not only the human mind but also embraced spirituality in his quest for self-discovery. Martin Heinrich Klaproth graces our path next through an exquisite engraving; he was instrumental in discovering several chemical elements that shaped our understanding of matter itself. Achromatogram appears once again in its two-dimensional glory – a testament to its versatility as it aids scientists across various fields in unraveling complex mixtures or identifying compounds within them. Our journey concludes with "The Painters March from Finchley, " an enchanting print by Paul Sandy from 1753.