
Graph Collection
"Unveiling the Intricacies: A Journey through Graphs" Step into a world where art and science intertwine, as we explore the captivating realm of graphs


All Professionally Made to Order for Quick Shipping
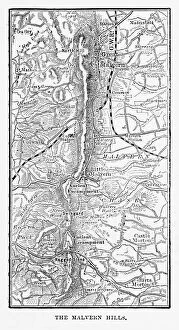
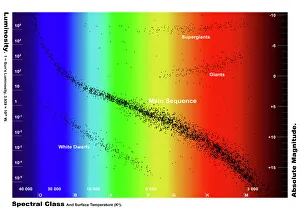
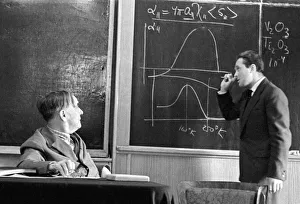
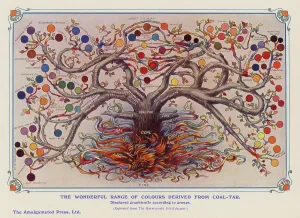
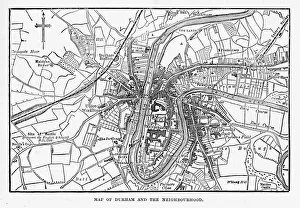
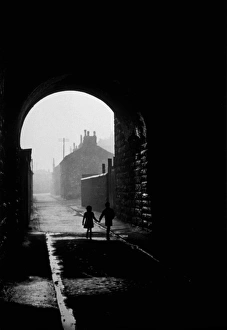
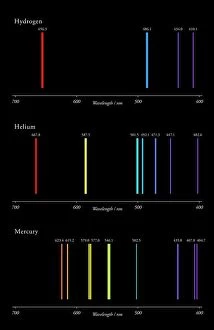
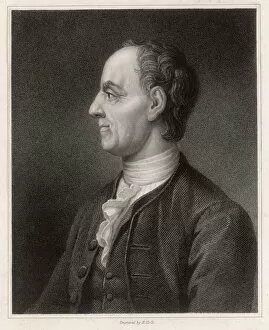
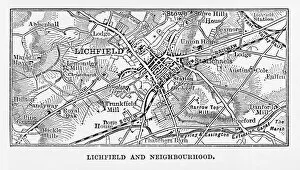
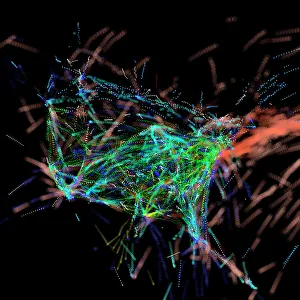
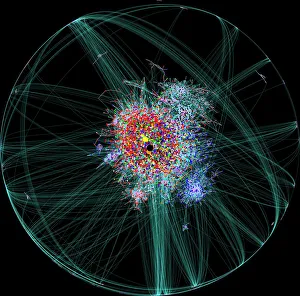
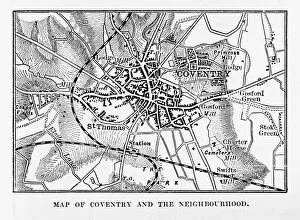
"Unveiling the Intricacies: A Journey through Graphs" Step into a world where art and science intertwine, as we explore the captivating realm of graphs. From the enchanting Map of Malvern Hills in Worcestershire, England Victorian Engraving, 1840 to the vibrant Colours derived from coal tar (colour litho), each graph tells a unique story. Travel back in time with us as we unravel history's secrets through the Map of the City of Durham, England Victorian Engraving, 1840. Witness how this intricate illustration captures an era long gone yet preserved within its lines. Delve into celestial wonders as you gaze upon the Diagram showing the spectral class and luminosity of stars. Marvel at their brilliance and understand how these cosmic entities are classified based on their radiant characteristics. Under The Arch lies a hidden world waiting to be discovered. Explore H-He-Hg emission spectra C017 / 7260 and uncover its mysteries alongside Kapitsa and Androv, Russian physicists who paved new paths in scientific exploration. Let us not forget those brilliant minds that shaped our understanding of graphs. Leonhard Euler, Swiss mathematician extraordinaire whose contributions revolutionized mathematics forever. His legacy lives on within every line etched onto paper or screen. Witness modern marvels unfold before your eyes with Air traffic visualization - a testament to human ingenuity ensuring safe skies for all travelers. Immerse yourself in Internet blog map showcasing interconnectedness like never before – bridging gaps between people across continents. Journey further through time with maps depicting Coventry in Warwickshire, England Victorian Engraving, 1840 and Exeter in Devon, England Victorian Engraving, 1840 – glimpses into bygone eras frozen within ink strokes. In this vast universe of knowledge encapsulated within graphs' allure lies endless possibilities waiting to be explored. So join us on this extraordinary expedition, where art meets science and history intertwines with innovation.