
Statistics Collection
"Unveiling the Power of Numbers: Exploring the Fascinating World of Statistics" From the majestic "Kiss of the Oceans


All Professionally Made to Order for Quick Shipping
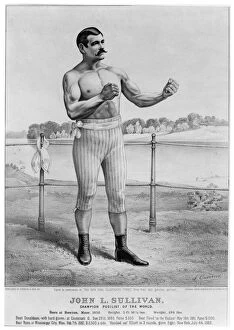
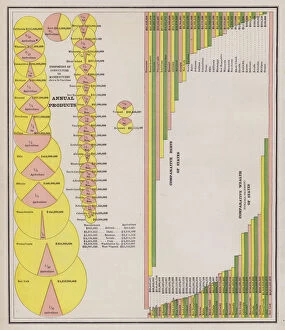
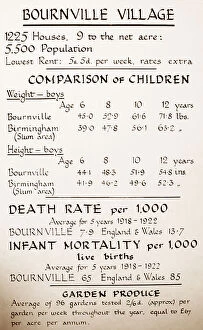
"Unveiling the Power of Numbers: Exploring the Fascinating World of Statistics" From the majestic "Kiss of the Oceans, " where Atlantic meets Pacific through the remarkable engineering feat of the Panama Canal, to historical artifacts like the "Daily Mail War Map" during WW1 and a British Empire world map from the 19th century, they have played an essential role in shaping our understanding of complex phenomena. In this captivating journey, we encounter influential figures such as John Venn, whose iconic caricature C013/7595 represents his groundbreaking work on probability and logic. We also delve into Gregor Mendel's pioneering research as an Austrian botanist, unraveling genetic inheritance patterns that laid the foundation for modern genetics. Even within sports history, they have left their mark. The lithograph by Currier and Ives depicting American heavyweight pugilist John L. Sullivan showcases how statistical analysis can capture athletic achievements and contribute to sporting legacies. Beyond individual accomplishments, statistics provide insights into societal progress. Colored engravings showcasing agricultural and manufacturing output alongside wealth and debts in the United States highlight how data has been used to assess economic growth or challenges throughout history. Moreover, G. H. Davis's exploration of factors governing invasions reminds us that statistical analysis extends beyond numbers alone; it encompasses strategic decision-making processes with real-world implications. Examining social issues is another realm where statistics prove invaluable. A glimpse at St Lukes Parish's statement on poor relief in 1854 demonstrates how data-driven approaches were employed to address poverty-related concerns even centuries ago. Fast forward to Bournville Village – a testament to George Cadbury's vision – where meticulously collected statistics shed light on its development as a model village promoting social welfare alongside industrial success in early 20th-century Britain. However, not all statistical findings are positive; they sometimes reveal alarming trends requiring attention.