Fraud Blocker Skip to main content

Thermograph Collection

Capturing the unseen, a thermograph reveals the warmth in unexpected moments

Background imageThermograph Collection: Baked gingerbread, thermogram

Baked gingerbread, thermogram
Baked gingerbread. Thermogram of gingerbread men cooling on a rack after being baked. The colours show variations in temperature

Background imageThermograph Collection: Playing guitar, thermogram

Playing guitar, thermogram
MODEL RELEASED. Playing guitar. Thermogram of a man playing an electric guitar. The colours show variation in temperature

Background imageThermograph Collection: Thermogram of a standing naked man (front view)

Thermogram of a standing naked man (front view)

Background imageThermograph Collection: Eating sandwich, thermogram

Eating sandwich, thermogram
MODEL RELEASED. Eating sandwich. Thermogram of a girl eating a sandwich. The colours show variation in temperature. The scale runs from white (warmest) through red, yellow

Background imageThermograph Collection: Thermogram of a man shaving

Thermogram of a man shaving
Man shaving. Thermogram of a man shaving, showing the variations in temperature. The temperature scale runs from red (warmest) through yellow, green, cyan and blue to mauve (coldest)

Background imageThermograph Collection: Thermogram of a man smoking a pipe

Thermogram of a man smoking a pipe, showing an increase in facial skin temperature. Thermography maps the pattern of heat distribution over the body surface to give a colour-coded image that shows

Background imageThermograph Collection: Thermogram of man

Thermogram of man
Thermogram of the head and upper torso of a naked man. Thermography is an imaging technique for mapping the heat distribution over the surface of a body

Background imageThermograph Collection: Core body temperature maintenance

Core body temperature maintenance
Body temperature regulation. Artwork based on a thermogram of the human body under different temperature conditions. It is warm at left and cold at right

Background imageThermograph Collection: Thermogram of a human finger

Thermogram of a human finger
Finger. Thermogram of a close-up of a human finger, showing the variation in surface temperature. The temperature scale runs from red (warmest) through yellow to green (coldest)

Background imageThermograph Collection: Couple dancing, thermogram

Couple dancing, thermogram
MODEL RELEASED. Couple dancing. Thermogram of a naked man and woman dancing with each other. The colours show variation in temperature

Background imageThermograph Collection: Thermogram of a man taking a shower

Thermogram of a man taking a shower
Head and shoulders. Thermogram of a man taking a shower, showing the variations in temperature. The temperature scale runs from red (warmest) through yellow, green, cyan and blue to mauve (coldest)

Background imageThermograph Collection: Hot drink, thermogram

Hot drink, thermogram

Background imageThermograph Collection: Thermogram of a mans head and shoulders

Thermogram of a mans head and shoulders
Head and shoulders. Thermogram of a mans head and shoulders, showing variation in temperature. The temperature scale runs from red (warmest) through yellow, green, cyan and blue to mauve (coldest)

Background imageThermograph Collection: Thermogram of head & shoulders of a man

Thermogram of head & shoulders of a man
Thermogram of the head and shoulders of a naked man. Thermography is an imaging technique for mapping the heat distribution over the surface of a body

Background imageThermograph Collection: Cats on window sill

Cats on window sill, thermogram image. These are domestic cats (Felis sylvestris). The colours show variations in temperature

Background imageThermograph Collection: Mans thermogram

Mans thermogram
Thermogram of the head and upper torso of a naked man. Thermography is an imaging technique for mapping the heat distribution over the surface of a body

Background imageThermograph Collection: Woman showering, thermogram

Woman showering, thermogram. The colours show variations in temperature, running from white (warmest), through yellow, orange, red and purple to blue (coldest)

Background imageThermograph Collection: Drying off, thermogram

Drying off, thermogram
Drying off. Thermogram of a man drying himself by standing wrapped in a towel. The colour-coding shows variations in temperature

Background imageThermograph Collection: Girl with bubblegum, thermogram

Girl with bubblegum, thermogram
MODEL RELEASED. Girl with bubblegum. Thermogram of a girl blowing a bubblegum bubble. The colours show variation in temperature

Background imageThermograph Collection: Thermogram of a mans head in profile

Thermogram of a mans head in profile
Head. Thermogram of a mans head in profile showing variation in temperature. The temperature scale runs from red (warmest) through yellow, green, cyan and blue to mauve (coldest)

Background imageThermograph Collection: Thermogram of a man drinking from a bottle

Thermogram of a man drinking from a bottle
Man drinking. Thermogram of a man drinking from a bottle, showing the variations in temperature. The temperature scale runs from red (warmest) through yellow and green to mauve (coldest)

Background imageThermograph Collection: Thermogram of feet wearing trainers

Thermogram of feet wearing trainers
Feet in trainers. Thermogram of a persons feet wearing trainers. The image shows the variation of surface temperature. The temperature scale runs from red (warmest) through yellow, green

Background imageThermograph Collection: Couple hugging, thermogram

Couple hugging, thermogram

Background imageThermograph Collection: Thermogram of head

Thermogram of head
SEPT 2006 Thermogram of a head. Thermography is an imaging technique for mapping the heat distribution over the surface of a body

Background imageThermograph Collection: Thermogram of feet

Thermogram of feet. Thermograms show the emission of infrared radiation, displaying it as colour- coded surface temperatures

Background imageThermograph Collection: Drinking beer, thermogram

Drinking beer, thermogram
MODEL RELEASED. Drinking beer. Thermogram of a man drinking a bottle of beer. The colours show variation in temperature. The scale runs from white (warmest) through red, yellow

Background imageThermograph Collection: Child on bike, thermogram

Child on bike, thermogram
Child on bike. Thermogram of a child riding a bicycle. A thermogram measures the heat produced by different objects, using photographic film that is sensitive to infrared radiation

Background imageThermograph Collection: Child in bath

Child in bath, thermogram image. The colours show variations in temperature. The scale runs from white (warmest), through yellow, orange, red and purple to blue (coldest)

Background imageThermograph Collection: Thermogram

Thermogram. Computer artwork representing a full- body thermogram of a standing man. Thermography measures the amount of heat (infrared radiation) emitted from the body surface

Background imageThermograph Collection: Child eating egg

Child eating egg
Child eating boiled egg, thermogram. The colours show variations in temperature. The scale runs from white (warmest), through yellow, orange, red and purple to blue (coldest)

Background imageThermograph Collection: Couple cuddling, thermogram

Couple cuddling, thermogram
MODEL RELEASED. Couple cuddling. Thermogram of a naked man and woman holding each other. The colours show variation in temperature

Background imageThermograph Collection: Thermogram of a baby

Thermogram of a baby drinking. Thermograms record the heat that is given off by an object as infrared radiation. The colours represent different temperatures, from the cold drink (18 degrees Celsius)

Background imageThermograph Collection: Thermogram of a rhea

Thermogram of a rhea

Background imageThermograph Collection: Jogging, thermogram

Jogging, thermogram
Jogging. Thermogram of a man jogging along a street. The colours show variation in temperature. The scale runs from white (warmest) through red, yellow, green and blue to purple (coldest)

Background imageThermograph Collection: Playing tennis, thermogram

Playing tennis, thermogram
Playing tennis. Thermogram of a person serving whilst playing tennis. The colours show variation in temperature. The scale runs from white (warmest) through red, yellow

Background imageThermograph Collection: Honeybees

Honeybees. Thermogram of honeybees (Apis mellifera) on honeycomb. The colours show variations in temperature. The scale runs from blue (coldest), through red, to yellow and white (warmest)

Background imageThermograph Collection: Baby, thermogram

Baby, thermogram
Baby. Thermogram of a baby propping itself up on its forearms. The colours show variation in temperature. The scale runs from white (warmest) through red, yellow, green and blue to purple (coldest)

Background imageThermograph Collection: Thermogram of a woman eating ice cream

Thermogram of a woman eating ice cream
Eating ice cream. Thermogram of a woman eating ice cream, showing the variations in temperature. The temperature scale runs from red (warmest) through yellow and green to mauve (coldest)

Background imageThermograph Collection: Thermogram of a woman in a supermarket

Thermogram of a woman in a supermarket
Supermarket. Thermogram of a woman pushing a shopping trolley in a supermarket. The image shows variation in temperature. The temperature scale runs from red (warmest) through yellow, green

Background imageThermograph Collection: Car, thermogram

Car, thermogram
Car. Thermogram of a car parked in a street. The colours show variation in temperature. The scale runs from white (warmest) through red, yellow, green and blue to purple (coldest)

Background imageThermograph Collection: Playing video game, thermogram

Playing video game, thermogram
Playing video game. Thermogram of a girl playing a video game at home. The colours show variation in temperature. The scale runs from white (warmest) through red, yellow

Background imageThermograph Collection: Car wheel, thermogram

Car wheel, thermogram. The car has been recently used as the brake discs are glowing white hot. The colours show variation in temperature

Background imageThermograph Collection: Houses, thermogram

Houses, thermogram
Houses. Thermogram of a row of terraced houses. The colours show variation in temperature. The scale runs from white (warmest) through red, yellow, green and blue to purple (coldest)

Background imageThermograph Collection: Laptop computer, thermogram

Laptop computer, thermogram. Laptop computers are designed for portability and in order to save space. A thermographic image is created by using a thermographic camera which detects radiation

Background imageThermograph Collection: Personal computer, thermogram

Personal computer, thermogram
Personal computer. Thermogram of a computer and monitor on a desk. The colours show variation in temperature. The scale runs from white (warmest) through red, yellow

Background imageThermograph Collection: Lamp, thermogram

Lamp, thermogram
Lamp. Thermogram of a lit lamp. The colours show variation in temperature. The scale runs from white (warmest) through red, yellow, green and blue to purple (coldest)

Background imageThermograph Collection: Woman using a mobile phone, thermogram

Woman using a mobile phone, thermogram
MODEL RELEASED. Woman using a mobile telephone, thermogram. The thermogram shows the emission of infrared radiation, displaying it as colour-coded surface temperatures

Background imageThermograph Collection: Man jumping, thermogram

Man jumping, thermogram. The colours show variation in temperature. The scale runs from white (warmest) through red, yellow, green and blue to purple (coldest)


All Professionally Made to Order for Quick Shipping

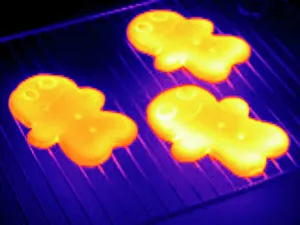
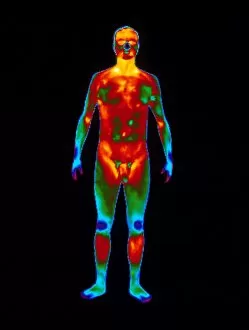
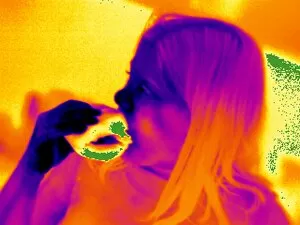
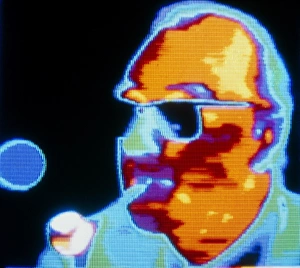
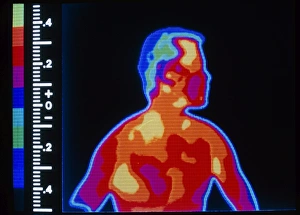
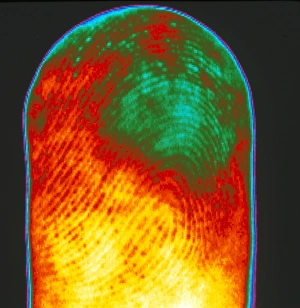
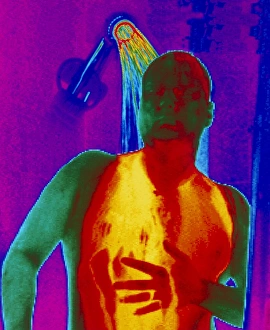
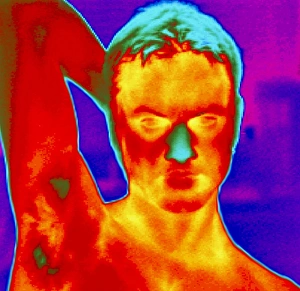
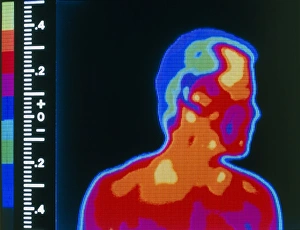
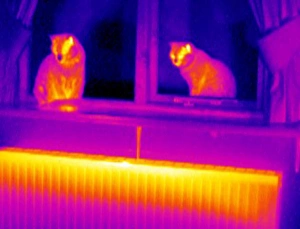
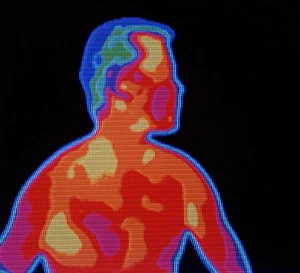
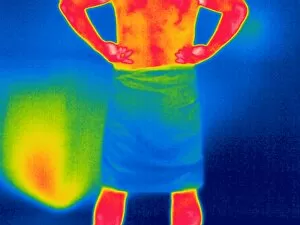
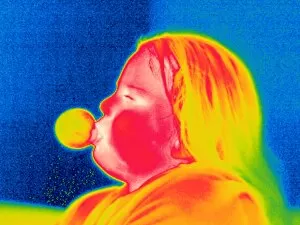
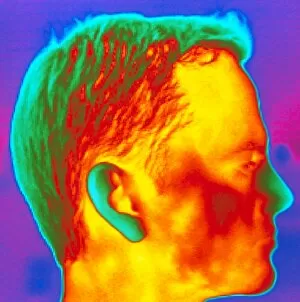
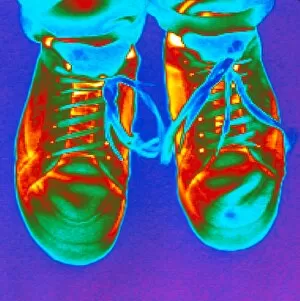
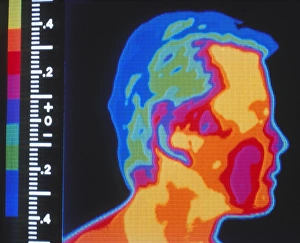
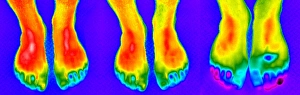
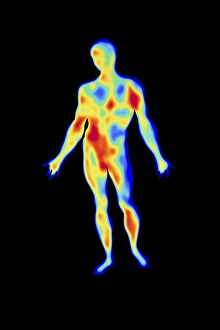
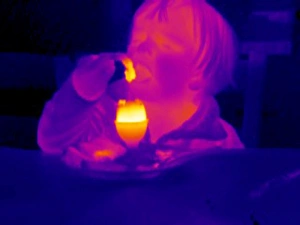
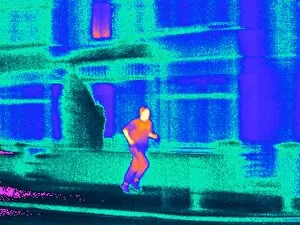
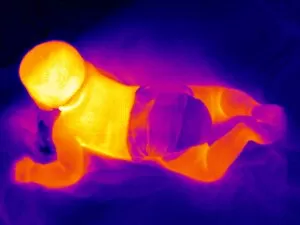
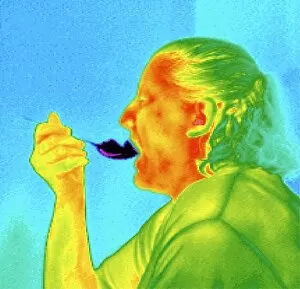
Capturing the unseen, a thermograph reveals the warmth in unexpected moments. From freshly baked gingerbread exuding delicious aromas to the soothing strums of a guitar resonating with passion, each scene comes alive through the lens of a thermogram. As we witness someone drying off after an invigorating swim or losing themselves in melodies while playing their favorite instrument, these thermal images offer a unique perspective on our daily lives. Even intimate moments are unveiled as couples find solace in each other's arms, their love radiating through the heat signatures captured by this remarkable technology. And just as it captures human connections, a thermogram also showcases mundane activities like savoring sandwiches and indulging in hot drinks – reminding us that even simple pleasures can be extraordinary when viewed from this thermal lens. It doesn't discriminate either; whether it's a man shaving or an innocent baby giggling, every subject becomes intriguingly illuminated by the invisible world revealed within these captivating thermographic snapshots.