
Visualization Collection
Visualization is the art of transforming complex data into captivating images that reveal hidden patterns and insights


All Professionally Made to Order for Quick Shipping
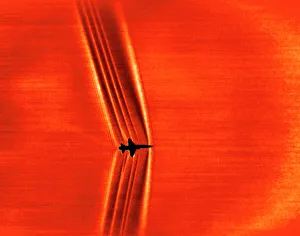
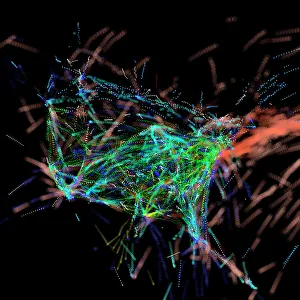
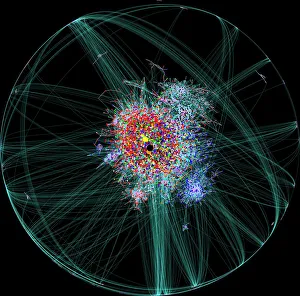
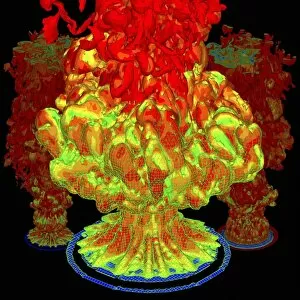
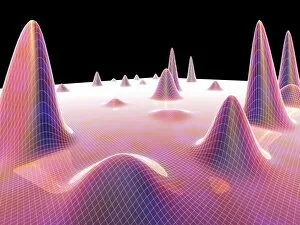
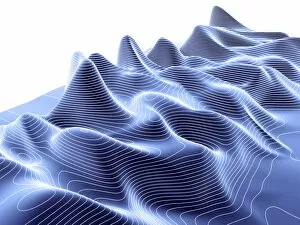
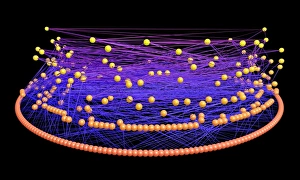
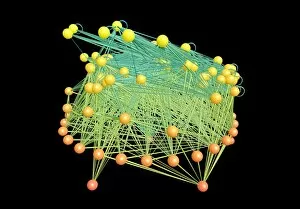
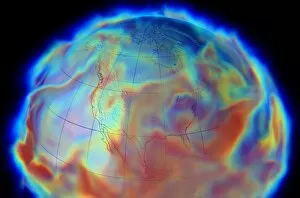
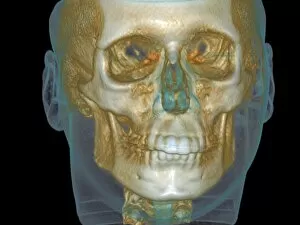
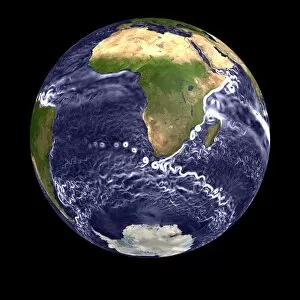
Visualization is the art of transforming complex data into captivating images that reveal hidden patterns and insights. From supersonic shock waves to Schlieren images, it allows us to see the invisible forces shaping our world. Air traffic visualization brings order to the chaotic dance of planes in the sky, painting a mesmerizing picture of connectivity and movement. In the realm of cyberspace, an internet blog map visualizes the vast expanse of online content, guiding us through a labyrinthine network with its intricate pathways and connections. It's like peering into a digital universe where ideas collide and knowledge thrives. But what about matters beyond this earthly realm? Can visualization shed light on topics like afterlife or heaven? While we may not have concrete answers, ethereal clouds gleaming with heavenly hues can evoke a sense of wonder and contemplation. Graphic depictions become windows to another dimension, expanding our horizons as we ponder life's mysteries. Zooming out from individual experiences, global winds come alive through stunning visualizations that showcase their dynamic nature. These swirling currents shape weather patterns across continents, reminding us how interconnected our planet truly is. Returning to virtual landscapes once more, website source code visualization unveils the intricate architecture behind our favorite online platforms. Like deciphering hieroglyphics in ancient tombs, these visuals offer glimpses into the inner workings of websites - revealing their complexity while showcasing their beauty. Fire plumes dancing in computer simulations create awe-inspiring spectacles that captivate both scientists and artists alike. The vivid colors and fluid movements bring forth an appreciation for technology's ability to recreate natural phenomena with astonishing accuracy. And finally, 3D surface graphs emerge as masterpieces born from computer artwork - mathematical equations transformed into visually stunning representations. With every curve meticulously crafted by algorithms' hands, they remind us that even abstract concepts can be brought to life through visualization techniques. In essence, visualization transcends boundaries between science and art, revealing the hidden beauty and complexity of our world.