Fraud Blocker Skip to main content

Block Diagram Collection

A block diagram is a powerful visual tool that helps us understand complex systems and processes

Background imageBlock Diagram Collection: Tectonic plate boundary types, diagram

Tectonic plate boundary types, diagram
Tectonic plate boundary types. Diagram showing three types of movement (arrows) at tectonic plate boundaries. Tectonic plates moving parallel to each other (bottom)

Background imageBlock Diagram Collection: Caribbean plate tectonics, artwork

Caribbean plate tectonics, artwork
Caribbean plate tectonics. Block artwork showing the formation of the arc of volcanic islands of the Lesser Antilles along a tectonic plate boundary (brown, arrowed line) in the Caribbean

Background imageBlock Diagram Collection: East African Rift tectonics, artwork

East African Rift tectonics, artwork
East African Rift tectonics. Block artwork of the Earths crust being pulled apart by plate tectonics in the Horn of Africa region of the East African Rift (Great Rift Valley)

Background imageBlock Diagram Collection: Earthquake movements, artwork

Earthquake movements, artwork
Earthquake movements, block artworks. At top is an unstressed block of the Earths crust, with three layers shown and the future fault line shown as a dotted blue line

Background imageBlock Diagram Collection: Geothermal district heating, artwork

Geothermal district heating, artwork
Geothermal district heating. Block artwork of the underground and surface pipes used to distribute steam or heated water in a district heating system

Background imageBlock Diagram Collection: North-western Atlantic, oceanography data C016 / 3739

North-western Atlantic, oceanography data C016 / 3739
North-western Atlantic, oceanography data. Cutaway block diagram of the north-western Atlantic Ocean, showing in exaggerated form the height of land terrain and the depth of the seabed

Background imageBlock Diagram Collection: Earths atmosphere, diagram

Earths atmosphere, diagram
Earths atmosphere. Block diagram showing altitude in kilometres (km) and phenomena observed in Earths atmosphere. This profile ranges from ground level (at the Ganges Plain and Tibetan Plateau)

Background imageBlock Diagram Collection: North-western Atlantic, bathymetry model C016 / 3738

North-western Atlantic, bathymetry model C016 / 3738
North-western Atlantic, bathymetry model. Cutaway block diagram of the north-western Atlantic Ocean, showing in exaggerated form the height of land terrain and the depth of the seabed

Background imageBlock Diagram Collection: Continental and oceanic crust, artwork C016 / 3737

Continental and oceanic crust, artwork C016 / 3737
Continental and oceanic crust. Cutaway block artwork of the Earths crust (brown) at the edge of a continent. It is thinnest beneath the ocean (far right), thicker beneath the continent (centre)


All Professionally Made to Order for Quick Shipping

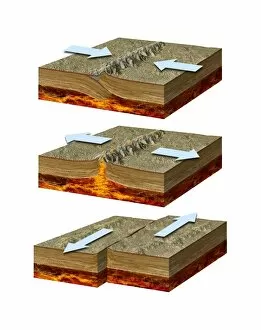
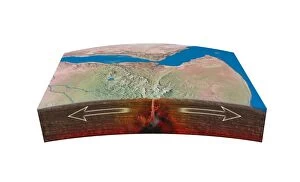
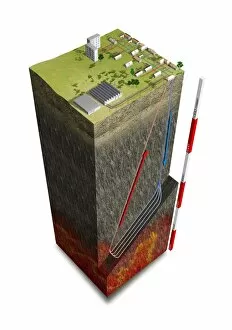
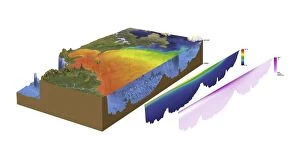
A block diagram is a powerful visual tool that helps us understand complex systems and processes. One such system is the tectonic plate boundary types, which can be beautifully depicted in a detailed diagram. This diagram showcases the different types of plate boundaries, such as divergent, convergent, and transform boundaries. Another fascinating aspect of Earth's structure can be explored through artwork depicting its internal layers. From the solid inner core to the liquid outer core, mantle, and crust, this artwork provides an insightful glimpse into our planet's composition. The Caribbean plate tectonics also come alive in stunning artwork showcasing the movement and interaction of plates in this region. The collision between the North American Plate and Caribbean Plate creates a unique geological landscape with volcanic activity and seismic events. Similarly, artwork illustrating East African Rift tectonics captures the gradual splitting of continental crusts over millions of years. This process leads to dramatic landscapes like deep valleys and elongated lakes. Earthquake movements are another captivating subject that can be represented through intricate artwork. These visuals bring to life how energy builds up along fault lines before being released in seismic waves that shake our planet's surface. In one striking piece of artistry, an earthquake triggers a tsunami – a devastating natural phenomenon caused by underwater disturbances. This depiction serves as a reminder of nature's immense power and its potential for destruction. On a more positive note, geothermal district heating is showcased through vibrant artwork demonstrating how heat from Earth's interior can be harnessed for sustainable energy solutions. This innovative approach benefits communities by providing clean heating options while reducing carbon emissions. For those interested in oceanography data or bathymetry models, block diagrams offer valuable insights into various regions' topography – like the north-western Atlantic – allowing scientists to study underwater features with precision. Lastly, let us not forget about Earth's atmosphere. Diagrams displaying its layers help us comprehend how gases envelop our planet while protecting and regulating its climate.