
Data Visualisation Collection
Data visualization is a powerful tool that allows us to comprehend complex information in a visually appealing and easily understandable format


All Professionally Made to Order for Quick Shipping
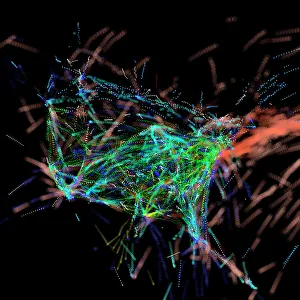
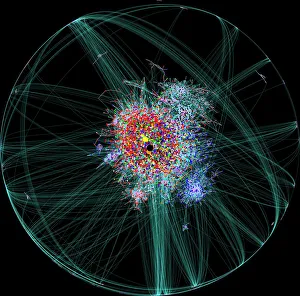
Data visualization is a powerful tool that allows us to comprehend complex information in a visually appealing and easily understandable format. From air traffic visualizations showcasing the intricate movements of planes across the globe, to internet blog maps revealing the interconnectedness of online content, data visualization brings clarity to our digital world. Intriguingly, website source code visualizations offer a unique glimpse into the underlying structure and complexity of websites we interact with daily. These captivating visuals provide insights into how websites are built and function. But data visualization isn't limited to just technology; it extends its reach even further. Ecological food webs come alive through stunning graphics that illustrate the delicate balance between species in various ecosystems. Whether it's an intricate depiction of an ecological food web or multiple representations highlighting different habitats, these visuals help us understand the interdependencies within nature. Imagine diving into Caribbean coral reef food web models where vibrant colors showcase the diverse marine life thriving beneath turquoise waters. These captivating illustrations allow us to appreciate not only the beauty but also the fragility of these underwater ecosystems. Through data visualization, we gain a deeper understanding of complex systems by transforming raw numbers and abstract concepts into tangible images that resonate with our senses. It enables scientists, researchers, and enthusiasts alike to explore vast amounts of information efficiently while uncovering patterns and trends that might otherwise go unnoticed. So next time you encounter a mesmerizing infographic or interactive chart, remember that behind those eye-catching visuals lies an artful representation designed to simplify complexity for our benefit. Data visualization truly bridges gaps between knowledge seekers and information providers by presenting facts in ways that captivate our imagination while enhancing comprehension.