
Isotherms Collection
Isotherms are graphical representations of temperature patterns across different regions and seasons


All Professionally Made to Order for Quick Shipping
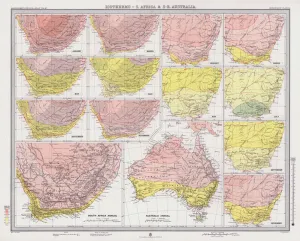
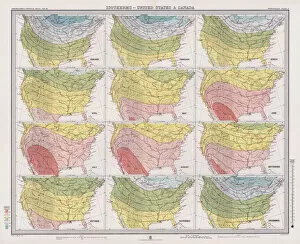
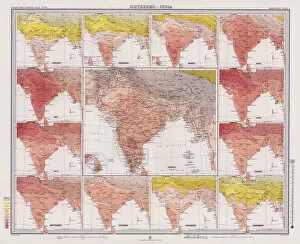
Isotherms are graphical representations of temperature patterns across different regions and seasons. They provide valuable insights into the variations in climate and help us understand the distribution of heat on our planet. In South Africa and South East Australia, isotherms depicted through color lithographs showcase the diverse temperature ranges experienced in these regions. From scorching summers to mild winters, these illustrations highlight the climatic diversity found in these areas. Anomalous weather and storms in North America are also captured through vibrant color lithographs. These visuals depict extreme weather events that deviate from normal patterns, emphasizing the importance of studying isotherms to comprehend such anomalies. A global perspective can be gained by examining isotherms worldwide. Color lithographs displaying isotherm maps allow us to compare temperatures across continents, providing a comprehensive view of Earth's thermal equilibrium. Through January and July temperature color lithographs, we can observe seasonal variations within specific locations. These visual representations enable us to analyze how temperatures fluctuate throughout the year, aiding meteorologists and researchers alike. The United States and Canada have their own set of unique isotherm maps showcased through colorful lithographs. By studying these depictions, we gain insight into regional climate differences between neighboring countries. Similarly, British Isles' isotherm color lithographs offer a glimpse into its distinct climate characteristics. The intricate patterns displayed on these maps reveal how this region experiences milder temperatures compared to other parts of Europe due to its proximity to oceanic currents. Europe's overall temperature distribution can be better understood by examining dedicated color lithograph illustrations showcasing its various isotherms. These visuals help identify regional disparities as well as similarities within this vast continent. La Chaleur a la Surface du Globe Terrestre presents captivating lines representing isothermal boundaries through an exquisite color lithograph artwork. This piece serves as a reminder that understanding global heat distribution plays a crucial role in comprehending Earth's complex climate systems holistically.