
Thermography Collection
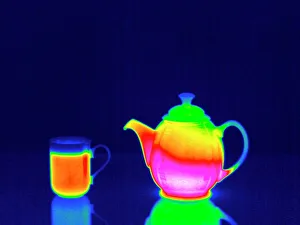
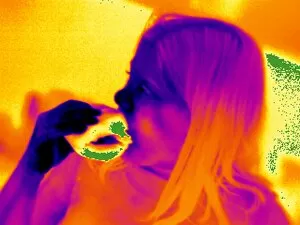
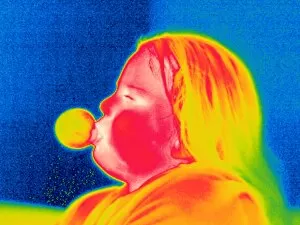
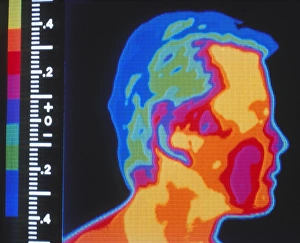
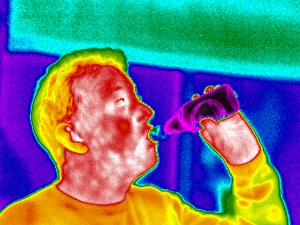
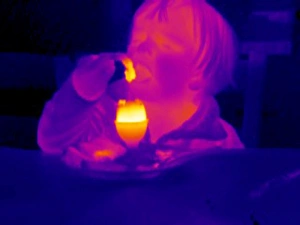
"Capturing the Invisible: Exploring Thermography's Colorful World" Sipping a hot drink from a teapot, as seen through a thermogram


All Professionally Made to Order for Quick Shipping
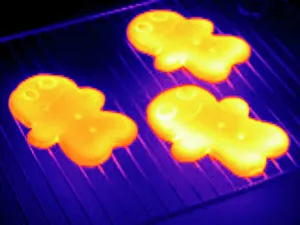
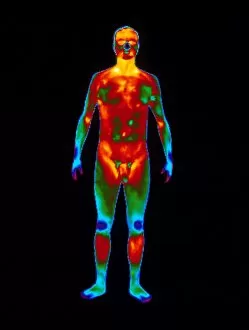
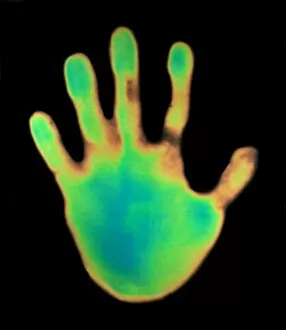
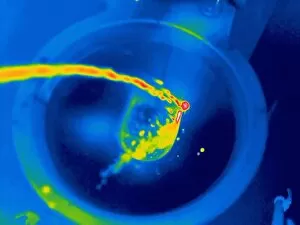
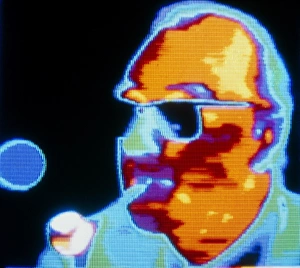
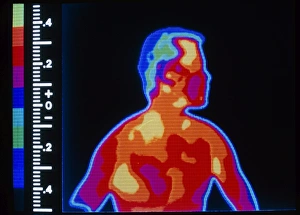
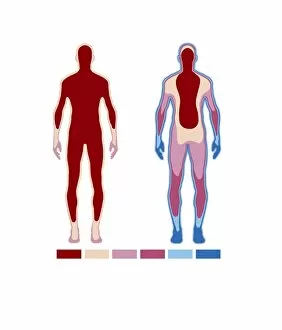
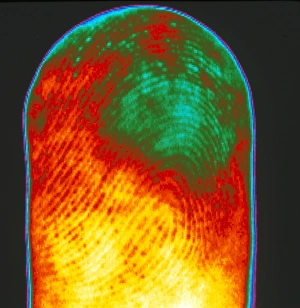
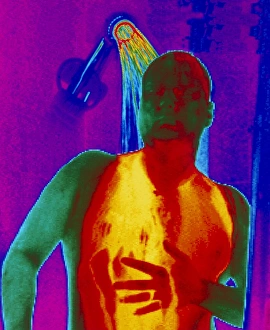
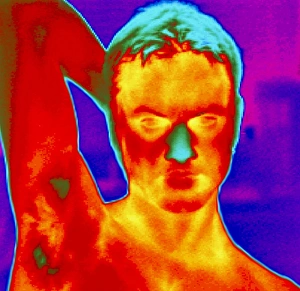
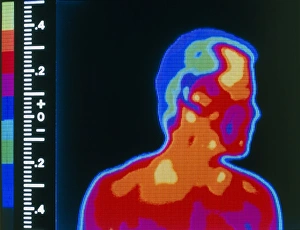
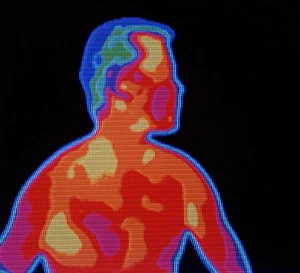
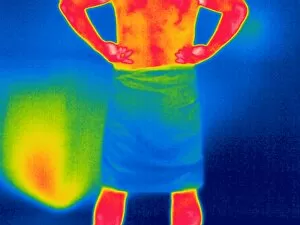
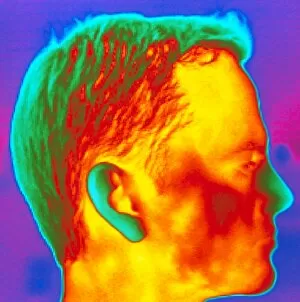
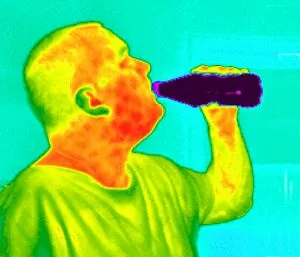
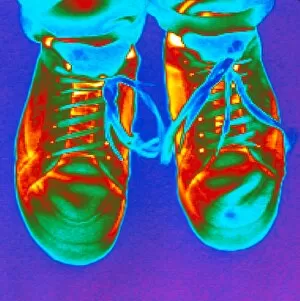
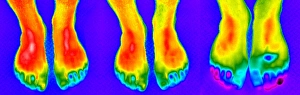
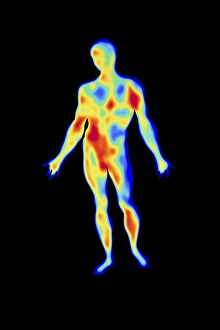
"Capturing the Invisible: Exploring Thermography's Colorful World" Sipping a hot drink from a teapot, as seen through a thermogram, reveals the warmth spreading in vibrant hues. The aroma of freshly baked gingerbread comes to life in a thermogram, showcasing its delicious heat signature. Strumming the guitar strings creates an enchanting melody that resonates visually on a thermogram canvas. Cooling towers stand tall against the sky, their thermal signatures painting an intricate pattern on the thermogram. After taking a refreshing shower, watch as your body dries off and leaves behind mesmerizing trails of warmth on the thermogram. Unleashing emotions through music; witness how playing guitar ignites fiery colors on the captivating landscape of a thermogram. A front view of a standing naked man captured by thermography unveils his unique thermal fingerprint with stunning clarity. Discover the hidden energy flowing through every touch as your hand imprints its warm mark onto a fascinating hand-shaped thermogram. Step into motion and witness each step leaving behind traces of warmth and movement on an intriguing foot-shaped thermogram. In an unexpected twist, even urine finds its place under scrutiny as it swirls within toilet bowls, revealing intriguing patterns in vivid detail through specialized urine-focused thermograms (C016 / 7563 & C016 / 7561). Women breaking stereotypes - explore gender equality with women using urinals showcased in thought-provoking female-specific urinal-themed thermograms (C016 / 7559). Thermography captures our world beyond what meets our eyes – unveiling unseen beauty and providing valuable insights into temperature variations across various objects and activities alike.