
Spectroscopy Collection (page 2)
Spectroscopy, a fascinating field of study that has revolutionized the way we understand matter and light


All Professionally Made to Order for Quick Shipping
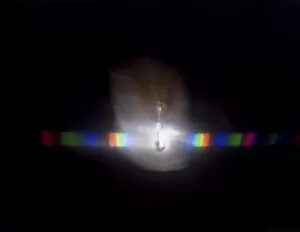
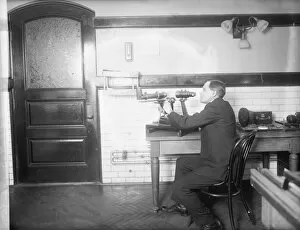
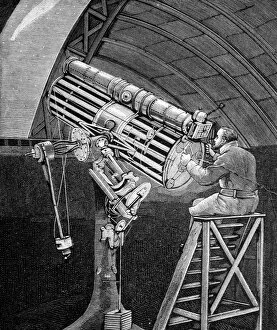
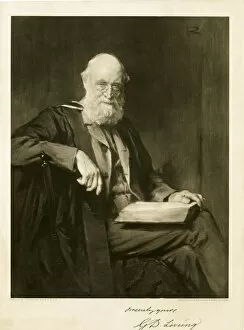
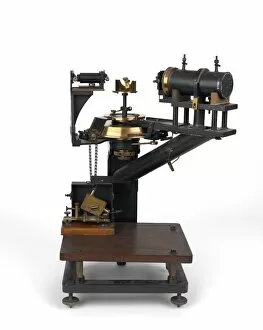
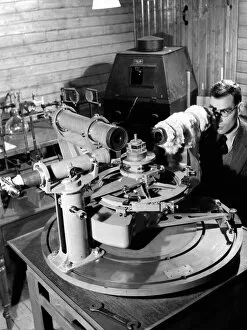
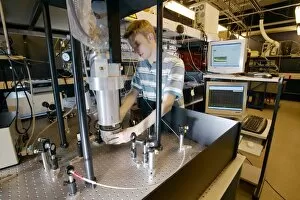
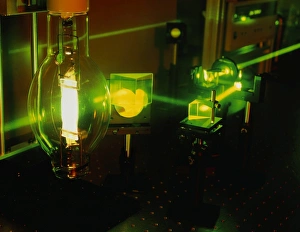
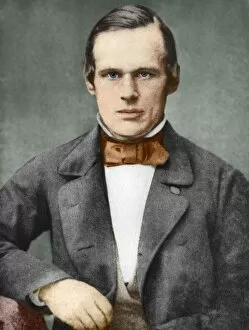
Spectroscopy, a fascinating field of study that has revolutionized the way we understand matter and light. Dating back to 1954 with the invention of the mass spectrometer, it has allowed scientists to delve into the intricate world of atoms and molecules. One of its earliest breakthroughs came in 1860 when Gustav Robert Kirchhoff, a German physicist, discovered emission spectra for hydrogen (H), helium (He), and mercury (Hg). This finding paved the way for elemental analysis, enabling researchers to identify elements based on their unique spectral fingerprints. In 1905, Sir William Huggins immortalized himself through an oil painting capturing his dedication to spectrum analysis. His work showcased how this technique could unveil hidden secrets about celestial bodies by analyzing their emitted light. Edmond Becquerel further contributed to spectroscopy's advancement through lithography depicting his experiments in spectral analysis. These colorful lithographs not only captured the beauty of scientific exploration but also highlighted how different substances absorb or emit specific wavelengths of light. The Bunsen-Kirchoff Spectroscope invented by Robert Bunsen was another milestone in this field. This device enabled scientists like Sir William Crookes, a British chemist and physicist depicted in black-and-white photography, to observe and analyze various spectra accurately. Charles Wheatstone's engraving serves as a reminder that spectroscopy is not limited solely to chemistry or physics but extends its reach across multiple disciplines, and is an interdisciplinary tool used in fields such as biology, astronomy, medicine, and environmental science. From absorption spectra revealing molecular structures to emission spectra unraveling distant stars' composition – spectroscopy continues to unlock mysteries at both macroscopic and microscopic scales. Its applications are vast; it aids forensic investigations by identifying trace evidence while assisting astronomers in understanding galaxies billions of light-years away. As we marvel at these captivating images showcasing different aspects of spectroscopy's evolution over time - from black-and-white photography to vibrant lithographs.