Fraud Blocker Skip to main content

Visualisation Collection

"Unleashing the Power of Visualisation

Background imageVisualisation Collection: Supersonic shock waves, Schlieren image

Supersonic shock waves, Schlieren image
Supersonic shock waves. Schlieren image showing the shock wave created by a supersonic jet flying in front of the Sun. Schlieren imaging is a method used to visualise density variations in

Background imageVisualisation Collection: Air traffic visualisation

Air traffic visualisation. Computer artwork of air traffic over the USA. This image is one frame from an animation of air traffic over a 24-hour period

Background imageVisualisation Collection: Internet blog map

Internet blog map. Computer generated map showing relationships between internet weblogs (blogs). Blogs are internet sites where entries are made in journal style

Background imageVisualisation Collection: Strange attractor, artwork

Strange attractor, artwork
Strange attractor, computer artwork

Background imageVisualisation Collection: Chaos waves, artwork

Chaos waves, artwork
Chaos waves, computer artwork. Chaotic systems are systems that look random but aren t. They are actually deterministic systems (predictable if you have enough information) governed by physical laws

Background imageVisualisation Collection: Microphone connected to Oscilloscope

Microphone connected to Oscilloscope

Background imageVisualisation Collection: Music made Visible by the Hon. Mrs Forbes Sempill

Music made Visible by the Hon. Mrs Forbes Sempill
Article by the Hon. Mrs Forbes Sempill (the step-daughter of Sir John Lavery), discussing the art of Pamela Colman Smith and her interpretative pictures made while listening to music. Date: 1927

Background imageVisualisation Collection: Music visualised by Pamela Colman Smith

Music visualised by Pamela Colman Smith
Page from The Illustrated London News showing the " visions of music" painted by Pamela Colman Smith, interpreted pieces of music through art. Date: 1927

Background imageVisualisation Collection: Sea surface salinity, Aquarius image C017 / 6816

Sea surface salinity, Aquarius image C017 / 6816
Sea surface salinity, Aquarius image. Computer model showing the salinity (dissolved salt-content) of the Atlantic Ocean, based on information recorded by the Aquarius spacecraft from December 2011

Background imageVisualisation Collection: Sea surface salinity, Aquarius image C017 / 6820

Sea surface salinity, Aquarius image C017 / 6820
Sea surface salinity, Aquarius image. Computer model showing the salinity (dissolved salt-content) of the oceans around Africa

Background imageVisualisation Collection: Sea surface salinity, Aquarius image C017 / 6817

Sea surface salinity, Aquarius image C017 / 6817
Sea surface salinity, Aquarius image. Computer model showing the salinity (dissolved salt-content) of the Atlantic and Pacific oceans

Background imageVisualisation Collection: Sea surface salinity, Aquarius image C017 / 6819

Sea surface salinity, Aquarius image C017 / 6819
Sea surface salinity, Aquarius image. Computer model showing the salinity (dissolved salt-content) of the Western Pacific Ocean

Background imageVisualisation Collection: Global surface currents 2005-2007 C016 / 8120

Global surface currents 2005-2007 C016 / 8120
Global surface currents 2005-2007. Computer visualisation showing ocean surface currents ff the coast of Asia, during the period from June 2005 to December 2007

Background imageVisualisation Collection: Global surface currents 2005-2007 C016 / 8119

Global surface currents 2005-2007 C016 / 8119
Global surface currents 2005-2007. Computer visualisation showing ocean surface currents around the tip of southern Africa, during the period from June 2005 to December 2007

Background imageVisualisation Collection: Thermohaline circulation, artwork C016 / 8121

Thermohaline circulation, artwork C016 / 8121
Thermohaline circulation. Computer artwork showing all 3 layers (shallow, middle and deep) of the large slow global currents driven by thermohaline circulation

Background imageVisualisation Collection: Thermohaline circulation, artwork C016 / 8122

Thermohaline circulation, artwork C016 / 8122
Thermohaline circulation. Computer artwork showing the large slow global currents (dotted line) driven by thermohaline circulation in the North Atlantic (upper right) and eastern Pacific (lower left)

Background imageVisualisation Collection: Global surface currents 2005-2007 C016 / 8115

Global surface currents 2005-2007 C016 / 8115
Earth surface currents 2005-2007. Computer visualisation showing ocean surface currents around the world during the period from June 2005 to December 2007

Background imageVisualisation Collection: Global surface currents 2005-2007 C016 / 8118

Global surface currents 2005-2007 C016 / 8118
Global surface currents 2005-2007. Computer visualisation showing ocean surface currents around North and Central America, centred on the Caribbean Sea and Atlantic Ocean

Background imageVisualisation Collection: Global surface currents 2005-2007 C016 / 8117

Global surface currents 2005-2007 C016 / 8117
Global surface currents 2005-2007. Computer visualisation showing ocean surface currents around the world, centred on the Pacific Ocean, during the period from June 2005 to December 2007

Background imageVisualisation Collection: Global surface currents 2005-2007 C016 / 8116

Global surface currents 2005-2007 C016 / 8116
Global surface currents 2005-2007. Computer visualisation showing ocean surface currents around the world, centred on the Indian Ocean, during the period from June 2005 to December 2007

Background imageVisualisation Collection: Website source code visualisation

Website source code visualisation, computer artwork. This image was created using WEB2DNA software which is able to transform the source code of a website into an image featuring bands and gaps

Background imageVisualisation Collection: Fire plumes, computer simulation

Fire plumes, computer simulation
Fire plumes. Computer simulation of large fire plumes. The simulation reveals turbulence and the unstable nature of fire plumes

Background imageVisualisation Collection: Ecological food web

Ecological food web, computer artwork. This model represents the extinct ecosystem of the Messel pit, Germany. Fossil animal and plant life is represented by the coloured nodes

Background imageVisualisation Collection: Caribbean coral reef food web model

Caribbean coral reef food web model
Ecological food web, computer artwork. This model represents the ecosystem of a Caribbean coral reef. Animal and plant life is represented by the coloured nodes

Background imageVisualisation Collection: Merged black holes

Merged black holes. Image 2 of 2. Supercomputer simulation of two non-spinning black holes (brown disc at centre) that have merged together

Background imageVisualisation Collection: Black holes merging

Black holes merging. Image 1 of 2. Supercomputer simulation of two non-spinning black holes (grey discs right and left of centre) merging

Background imageVisualisation Collection: Atmospheric humidity, computer simulation

Atmospheric humidity, computer simulation
Atmospheric humidity. Computer simulation showing specific atmospheric humidity in the Earths northern hemisphere on 17th June 1993, during the Great Flood that hit the Midwestern United States

Background imageVisualisation Collection: Normal head, cone beam CT scan

Normal head, cone beam CT scan. Front view of a dental patients head. The scan was produced using a cone beam x-ray computed tomography (CT) scanner

Background imageVisualisation Collection: Ocean current speed

Ocean current speed. Computer visualisation of ocean surface current speeds. Major ocean currents (coloured white) are visible, such as the Agulhas current (eastern side of Africa)

Background imageVisualisation Collection: Ufos / Journals / Bender

Ufos / Journals / Bender
Benders cover for the second issue of Gray Barkers magazine The Saucerian, incorporated his visualisation of a saucer base and led to a visit from the Three Men


All Professionally Made to Order for Quick Shipping

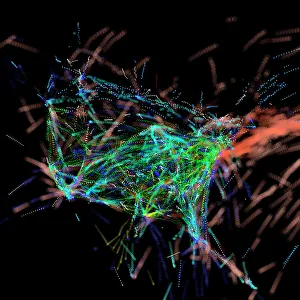
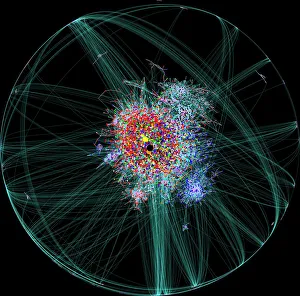
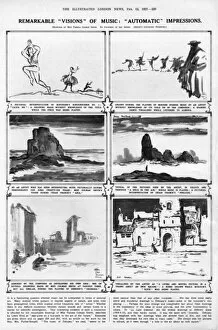
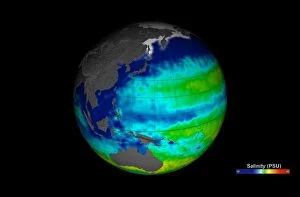
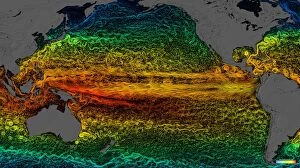
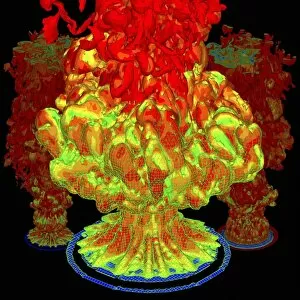
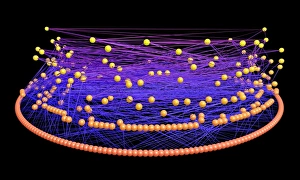
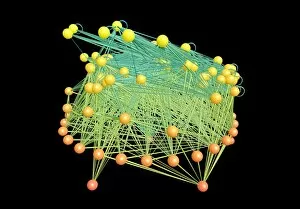
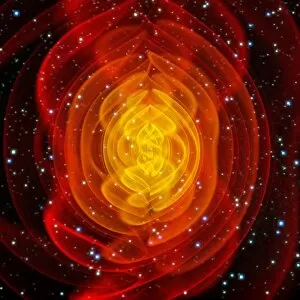
"Unleashing the Power of Visualisation: From Supersonic Shock Waves to Quark Structures" a captivating tool that allows us to explore and understand complex phenomena in ways unimaginable. Take, for instance, the mesmerizing Schlieren image capturing supersonic shock waves as they ripple through the air. This visual representation not only showcases their immense power but also provides valuable insights into aerodynamics. In the realm of air traffic management, visualisation plays a crucial role in ensuring safe and efficient operations. An internet blog map displaying real-time flight movements offers an impressive spectacle while aiding professionals in monitoring and optimizing routes. Artistic expression finds its place within visualisation too. The enigmatic artwork depicting strange attractors or chaos waves invites viewers to delve into abstract realms where mathematics meets creativity. Equally intriguing is the visualisation of quark structures within protons, unraveling the fundamental building blocks of matter with breathtaking precision. Music has long been intertwined with visuals, as demonstrated by Hon. Mrs Forbes Sempill's pioneering work on making music visible. Her innovative techniques allow soundwaves to materialize before our eyes, transforming auditory sensations into tangible beauty. Pamela Colman Smith further expands this connection between music and visuals through her artistic interpretations. By translating melodies into vibrant imagery, she adds another layer of depth to our perception of musical compositions. Visualisations extend beyond artistry; they find practical applications too. Cooling and lubrication systems for high-speed vessels like Miss England III rely heavily on precise visual representations to ensure optimal performance under extreme conditions. Even scientific instruments embrace visualisation as a means of understanding intricate data patterns. A microphone connected to an oscilloscope unveils sound waveforms visually, enabling scientists and engineers alike to analyze audio signals with utmost accuracy. The wonders of nature are not exempt from being captured visually either – consider Aquarius' sea surface salinity image C017/6816 showcasing variations across the globe.