
Temperatures Collection
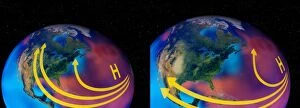
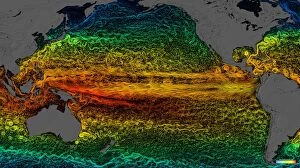
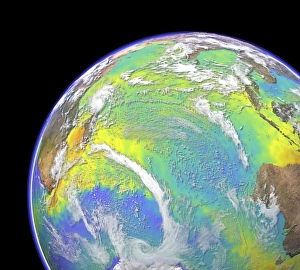
"Exploring the Dynamic Temperatures: From Ocean Currents to Welding and Beyond" Ocean currents off the Americas


All Professionally Made to Order for Quick Shipping
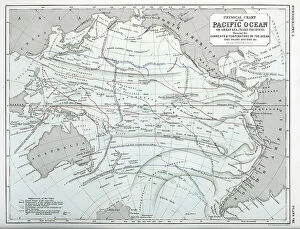
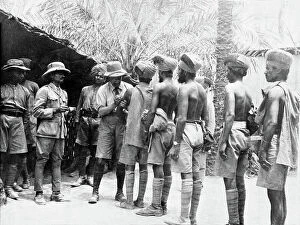
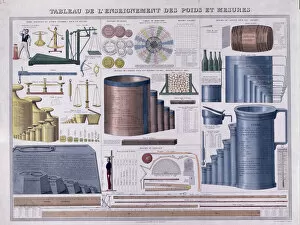
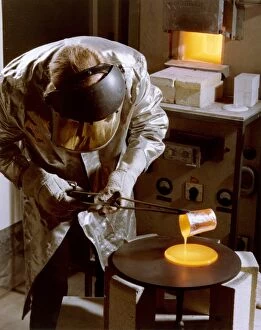
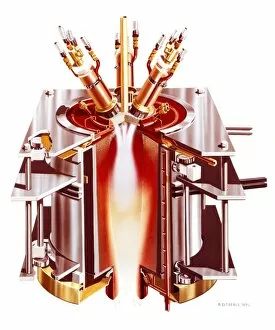
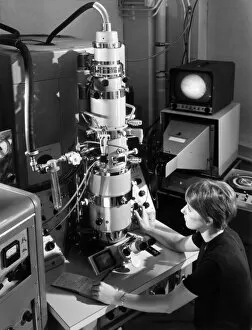
"Exploring the Dynamic Temperatures: From Ocean Currents to Welding and Beyond" Ocean currents off the Americas: Dive into the fascinating world as we unravel the impact of ocean currents on climate variations. Oxy-acetylene welding: Discover how extreme temperatures play a crucial role in this cutting-edge welding technique, where precision meets heat. Aboard the Carpathia: Step back in time to understand how temperature fluctuations affected rescue efforts during one of history's most tragic maritime disasters. Physical Chart of Indian Ocean (Currents, Temperatures?): Unveiling the secrets hidden beneath the waves, explore how temperature patterns shape marine life and trade routes in this vast expanse. Physical Chart of Atlantic Ocean (Currents, Temperatures?): Journey across continents through changing water temperatures that influence weather systems and impact global navigation. Physical Chart of Pacific Ocean (Currents, Temperatures?): Embark on an expedition through diverse climates shaped by varying oceanic temperatures that dictate everything from fishing grounds to tropical storms. RMS Titanic - shipping chart of North Atlantic: Delve into the chilling story behind one ill-fated voyage as we examine how freezing waters played a pivotal role in shaping history's most iconic shipwreck tragedy. Photograph of Indian troops lined up to receive inoculations: Witness firsthand how temperature control is vital for preserving vaccines and protecting lives against infectious diseases worldwide. Canberra Weather Stock: Explore how accurate temperature forecasts empower communities with essential information for planning daily activities or preparing for severe weather events. Table of weights and measures, mid-19th century (colour engraving): Take a glimpse into historical measurements influenced by factors such as altitude and temperature – key elements that have shaped our understanding since ancient times. Page from Jordans Enamelled Signs (colour litho): Discover how different materials respond to fluctuating temperatures, influencing the durability and appearance of everyday objects.