
Metabolic Collection
"Unlocking the Mysteries of Metabolic Pathways: A Journey into Cellular Energy" Step into the microscopic world and explore the intricate realm of metabolism


All Professionally Made to Order for Quick Shipping
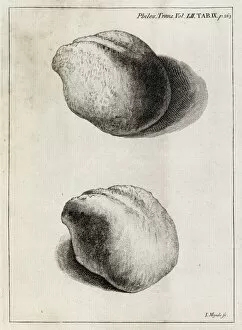
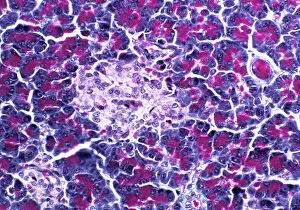
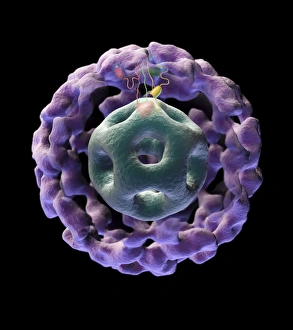
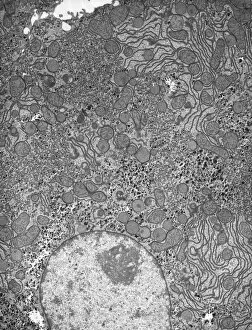
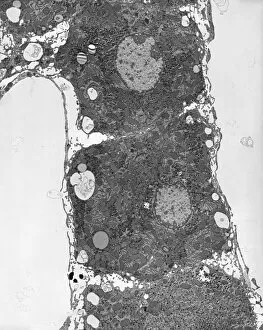
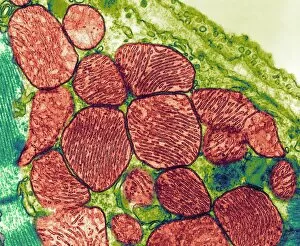
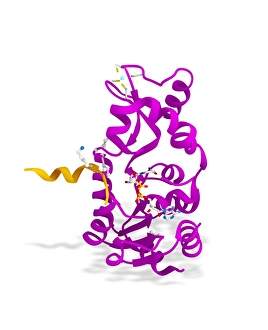
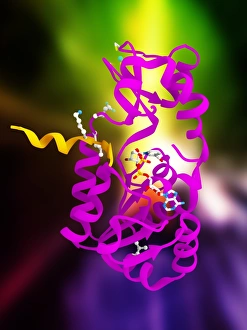
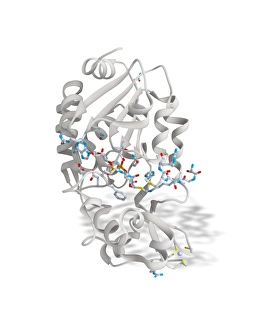
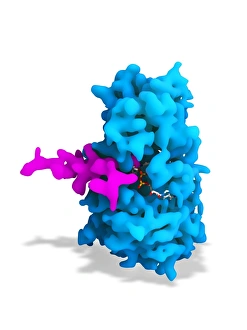
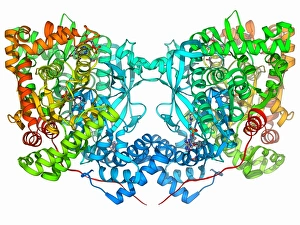
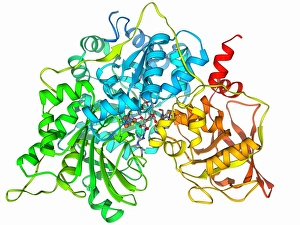
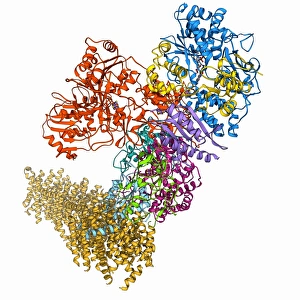
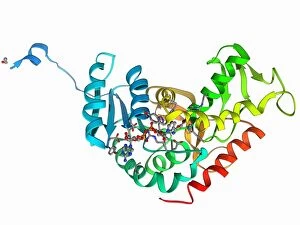
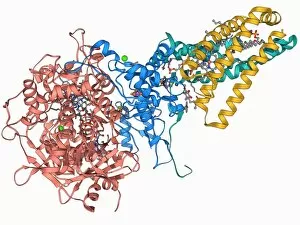
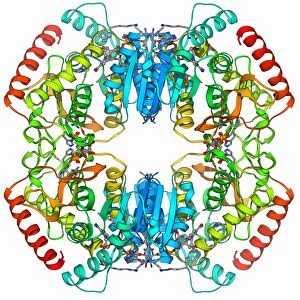
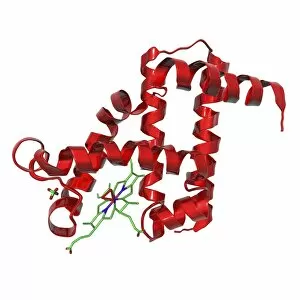
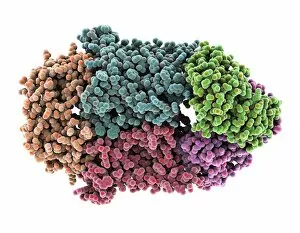
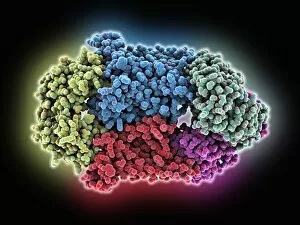
"Unlocking the Mysteries of Metabolic Pathways: A Journey into Cellular Energy" Step into the microscopic world and explore the intricate realm of metabolism, where energy production takes center stage. The mitochondrion, often referred to as the powerhouse of the cell, plays a crucial role in this captivating process. Through a transmission electron microscope (TEM), we witness its majestic structure and marvel at its ability to generate ATP. But let us not confine ourselves solely to mitochondria; our journey through metabolic wonders takes us further back in time. In the 18th century, kidney stones puzzled medical minds. Little did they know that these mineral formations were intricately linked to metabolic imbalances within our bodies. Moving on from ancient mysteries, we delve into the artistry of thyroid anatomy captured in artwork C013 / 4675. This visual masterpiece unveils the complexity and beauty hidden beneath our skin – an organ responsible for regulating metabolism and maintaining balance within our body. Zooming even closer under another lens (C015 / 6696), we encounter cytochrome b5 molecules dancing their elegant molecular ballets. These tiny performers play essential roles in various metabolic reactions, orchestrating biochemical pathways with precision. As we navigate deeper into cellular landscapes using scanning electron microscopy (SEM), breathtaking images reveal intricate networks of thyroid gland capillaries intertwining like delicate threads connecting life's vital processes. Our exploration continues with a glimpse inside pancreatic islets of Langerhans – miniature islands amidst a sea of cells dedicated to producing hormones that regulate blood sugar levels and fuel metabolism. Returning once again to SEM imagery, we are captivated by stunning visuals showcasing thyroid gland blood vessels branching out like lifelines nourishing every corner of this remarkable organ. The magnificence doesn't end there; SEM reveals yet another spectacle – mitochondria standing tall like sentinels guarding cellular energy reserves. Their unique structures hint at their indispensable role in sustaining life's processes.