Fraud Blocker Skip to main content

Metabolism Collection

"Unveiling the Mysteries of Metabolism

Background imageMetabolism Collection: Theodor Schwann, German physiologist

Theodor Schwann, German physiologist who made many contributions to biology and coined the term metabolism

Background imageMetabolism Collection: Myoglobin molecule C015 / 5702

Myoglobin molecule C015 / 5702
Myoglobin molecule. Computer model showing the structure of a myoglobin molecule. Myoglobin is a protein found in muscle tissue

Background imageMetabolism Collection: Mitochondrion, TEM

Mitochondrion, TEM
Mitochondrion. Coloured transmission electron micrograph (TEM) of mitochondria (green/blue) in heart muscle. Mitochondria are organelles found in the cytoplasm of eukaryotic cells

Background imageMetabolism Collection: Kidney stone, 18th century

Kidney stone, 18th century

Background imageMetabolism Collection: Thyroid anatomy, artwork C013 / 4675

Thyroid anatomy, artwork C013 / 4675
Thyroid anatomy. Computer artwork of the thyroid glands (pink) of the neck, shown in relation to the bodys bones and throat structures (white)

Background imageMetabolism Collection: Cytochrome b5 molecule C015 / 6696

Cytochrome b5 molecule C015 / 6696
Cytochrome b5. Molecular model of cytochrome b5 from a cows liver. Cytochrome molecules perform oxidation and reduction reactions for electron transport

Background imageMetabolism Collection: Santorio Santorio

Santorio Santorio
5307546 Santorio Santorio.; (add.info.: Engraving depicting Santorio Santorio seated in his balance (a steelyard) in which he could eat and sleep

Background imageMetabolism Collection: Sanctorius seated in his balance, 1711 (engraving)

Sanctorius seated in his balance, 1711 (engraving)
540611 Sanctorius seated in his balance, 1711 (engraving); (add.info.: Sanctorius (Sanctorio Sanctorio) (1561-1636) Italian physician and physiologist, friend of Galileo

Background imageMetabolism Collection: Diagram showing human liver, stomach, gallbladder and pancreas

Diagram showing human liver, stomach, gallbladder and pancreas

Background imageMetabolism Collection: TFAM transcription factor bound to DNA C015 / 7059

TFAM transcription factor bound to DNA C015 / 7059
TFAM transcription factor bound to DNA, molecular model. Human mitochondrial transcription factor A (TFAM, green) bound to a strand of DNA (deoxyribonucleic acid, blue and pink)

Background imageMetabolism Collection: Relation of thyroid and pituitary gland

Relation of thyroid and pituitary gland

Background imageMetabolism Collection: Cytochrome P450 complex F006 / 9669

Cytochrome P450 complex F006 / 9669
Cytochrome P450 complex. Molecular model of a complex composed of cytochrome P450, carbon monoxide and camphor. Cytochrome molecules perform oxidation and reduction reactions for electron transport

Background imageMetabolism Collection: Succinyl-CoA synthetase enzyme F006 / 9592

Succinyl-CoA synthetase enzyme F006 / 9592
Succinyl-CoA synthetase bound to GTP, molecular model. Also known as succinyl coenzyme A synthetase (SCS), this enzyme catalyses the reversible reaction between succinyl-CoA and succinic acid

Background imageMetabolism Collection: Pyruvate dehydrogenase complex C018 / 9192

Pyruvate dehydrogenase complex C018 / 9192
Pyruvate dehydrogenase complex, 3D model. This enzyme complex is responsible for the step that links glycolysis to the citric acid (Krebs) cycle

Background imageMetabolism Collection: Diabetes education, blood viscosity

Diabetes education, blood viscosity
MODEL RELEASED. Diabetes education. Nurse using models to demonstrate high blood viscosity to a diabetic patient. The models show red blood cells in healthy blood at left

Background imageMetabolism Collection: Hepatocyte liver cell, TEM

Hepatocyte liver cell, TEM
Hepatocyte liver cell. Transmission electron micrograph (TEM) of a section through an hepatocyte liver cell, showing rough and smooth endoplasmic reticulum (ER, dark lines)

Background imageMetabolism Collection: Liver tissue, TEM

Liver tissue, TEM
Liver tissue. Transmission electron micrograph (TEM) of a section through the liver, showing part of a radial cord of hepatocyte liver cells (dark) and the vascular sinusoids (white)

Background imageMetabolism Collection: Mitochondria, TEM

Mitochondria, TEM
Mitochondria. Coloured transmission electron micrograph (TEM) of mitochondria (red) in heart muscle. Mitochondria are organelles found in the cytoplasm of eukaryotic cells

Background imageMetabolism Collection: Mitochondria, SEM

Mitochondria, SEM
Mitochondria. Coloured scanning electron micrograph (SEM) of mitochondria (red) in a kidney cell. Mitochondria are a type of organelle found in the cytoplasm of eukaryotic cells

Background imageMetabolism Collection: Illustration showing nephron structure and kidney

Illustration showing nephron structure and kidney
Human anatomy: nephron structure. Drawing

Background imageMetabolism Collection: Illustration of muscle contraction

Illustration of muscle contraction

Background imageMetabolism Collection: Close-up view of thyroid gland

Close-up view of thyroid gland

Background imageMetabolism Collection: X-ray view of human skeleton with liver

X-ray view of human skeleton with liver

Background imageMetabolism Collection: 3D structure of pyruvate dehydrogenase complex

3D structure of pyruvate dehydrogenase complex
3D structure of the 11 megadalton pyruvate dehydrogenase complex which is responsible for synthesis of the key metabolite acetyl CoA

Background imageMetabolism Collection: Illustration of muscle contraction (with labels)

Illustration of muscle contraction (with labels)

Background imageMetabolism Collection: Sanctorius (Sanctorio Sanctorio) (1561-1636) Italian physician and physiologist, friend of Galileo

Sanctorius (Sanctorio Sanctorio) (1561-1636) Italian physician and physiologist, friend of Galileo. Shown here seated in his balance (a steelyard) in which he could eat and sleep

Background imageMetabolism Collection: Illustration showing kidney

Illustration showing kidney
Medicine: kidney

Background imageMetabolism Collection: Illustration showing excretory organs

Illustration showing excretory organs
Medicine: excretory organs

Background imageMetabolism Collection: Illustration showing human liver

Illustration showing human liver
Medicine: digestive system, liver

Background imageMetabolism Collection: Orange halves, juicer and glass of freshly squeezed orange juice

Orange halves, juicer and glass of freshly squeezed orange juice

Background imageMetabolism Collection: Sirtuin enzyme and p53, artwork C017 / 3659

Sirtuin enzyme and p53, artwork C017 / 3659
Sirtuin enzyme and p53. Computer artwork of a sirtuin (Sir2) enzyme (pink) bound to a p53 peptide (orange). Sir2 enzymes form a unique class of NAD(+)

Background imageMetabolism Collection: Sirtuin enzyme and p53, artwork C017 / 3658

Sirtuin enzyme and p53, artwork C017 / 3658
Sirtuin enzyme and p53. Computer artwork of a sirtuin (Sir2) enzyme (pink) bound to a p53 peptide (orange). Sir2 enzymes form a unique class of NAD(+)

Background imageMetabolism Collection: SIRT3 molecule, artwork C017 / 3657

SIRT3 molecule, artwork C017 / 3657
SIRT3 molecule. Computer artwork showing the structure of a molecule of NAD-dependent deacetylase sirtuin-3, mitochondrial (SIRT3)

Background imageMetabolism Collection: Insulin, artwork F007 / 7233

Insulin, artwork F007 / 7233
Insulin, computer artwork

Background imageMetabolism Collection: Insulin, artwork F007 / 7234

Insulin, artwork F007 / 7234
Insulin, computer artwork

Background imageMetabolism Collection: Urine diabetes test C014 / 1231

Urine diabetes test C014 / 1231
MODEL RELEASED. Urine diabetes test. Woman using a urine self-test for diabetes. This test detects the levels of glucose and ketone in the urine

Background imageMetabolism Collection: Circulating insulin, artwork F006 / 2355

Circulating insulin, artwork F006 / 2355
Insulin. Computer artwork of molecules of insulin circulating in the blood stream

Background imageMetabolism Collection: Circulating insulin, artwork F006 / 2354

Circulating insulin, artwork F006 / 2354
Insulin. Computer artwork of molecules of insulin circulating in the blood stream

Background imageMetabolism Collection: Circulating insulin, artwork F006 / 2353

Circulating insulin, artwork F006 / 2353
Insulin. Computer artwork of a molecule of insulin circulating in the blood stream

Background imageMetabolism Collection: Sirtuin enzyme and p53, artwork C017 / 3660

Sirtuin enzyme and p53, artwork C017 / 3660
Sirtuin enzyme and p53. Computer artwork of a sirtuin (Sir2) enzyme (blue) bound to a p53 peptide (pink). Sir2 enzymes form a unique class of NAD(+)

Background imageMetabolism Collection: Glycogen phosphorylase molecule F006 / 9775

Glycogen phosphorylase molecule F006 / 9775
Glycogen phosphorylase. Molecular model of glycogen phosphorylase bound to AMP (adenosine monophosphate). This is an enzyme involved in breaking down glycogen

Background imageMetabolism Collection: Metabolic enzyme molecule F006 / 9770

Metabolic enzyme molecule F006 / 9770
Metabolic enzyme. Molecular model of the enzyme aconitase with isocitrate bound. Aconitase is involved in the citric acid (or Krebs) cycle

Background imageMetabolism Collection: Human muscle aldolase, molecular model F006 / 9742

Human muscle aldolase, molecular model F006 / 9742
Human muscle aldolase. Molecular model of the enzyme human muscle aldolase complexed with its substrate fructose 1, 6-bisphosphate

Background imageMetabolism Collection: Oxidoreductase enzyme complex F006 / 9725

Oxidoreductase enzyme complex F006 / 9725
Oxidoreductase enzyme complex, molecular model. This is the membrane-bound domain formed from of a complex of NADH-quinone oxidoreductase subunits

Background imageMetabolism Collection: Oxidoreductase enzyme complex F006 / 9700

Oxidoreductase enzyme complex F006 / 9700
Oxidoreductase enzyme complex. Molecular model of a complex of NADH-quinone oxidoreductase subunits. The whole is termed respiratory complex I

Background imageMetabolism Collection: Cytochrome C, molecular model F006 / 9696

Cytochrome C, molecular model F006 / 9696
Cytochrome C, molecular model. Cytochrome molecules perform oxidation and reduction reactions for electron transport, a chain of reactions used to power cellular processes that require energy

Background imageMetabolism Collection: Lactate dehydrogenase enzyme molecule F006 / 9699

Lactate dehydrogenase enzyme molecule F006 / 9699
Lactate dehydrogenase enzyme, molecular model. This enzyme converts pyruvate to lactate in the final steps of glycolysis, and lactate to pyruvate during the lactic acid cycle

Background imageMetabolism Collection: Cytochrome BC1 molecule F006 / 9681

Cytochrome BC1 molecule F006 / 9681
Cytochrome BC1, Molecular model. Cytochrome molecules perform oxidation and reduction reactions for electron transport, a chain of reactions used to power cellular processes that require energy


All Professionally Made to Order for Quick Shipping

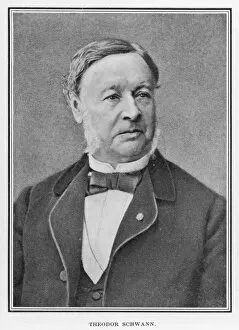
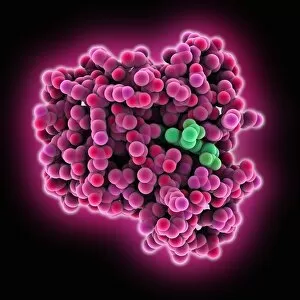
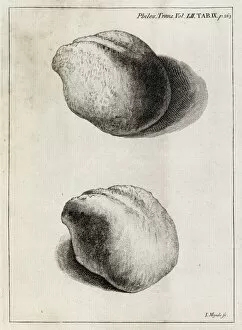
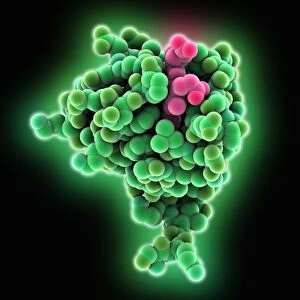
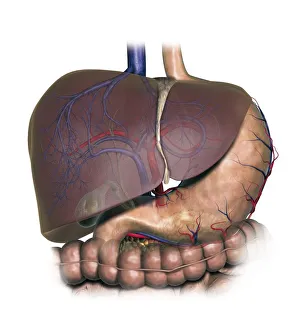
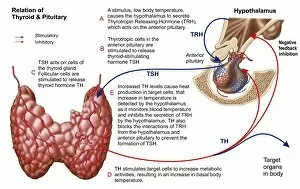
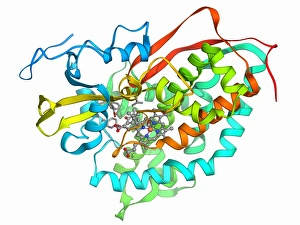
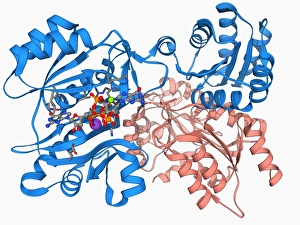
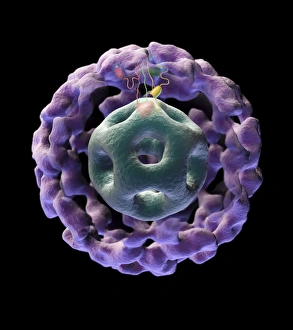
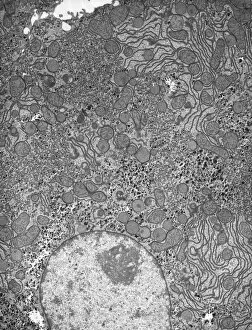
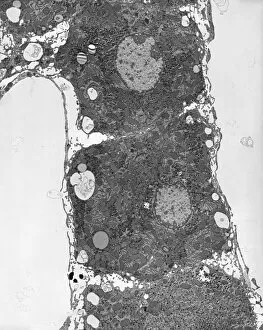
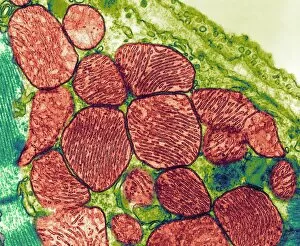
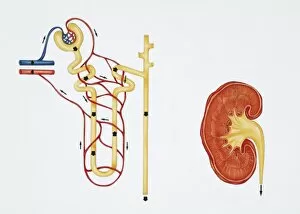
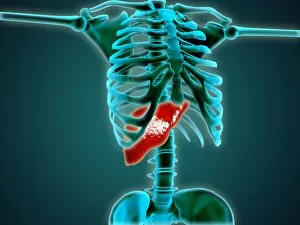
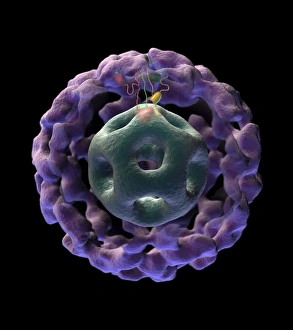
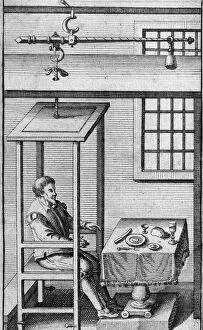
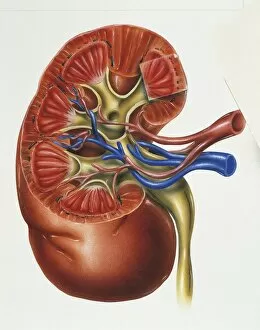
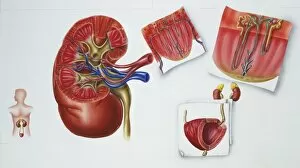
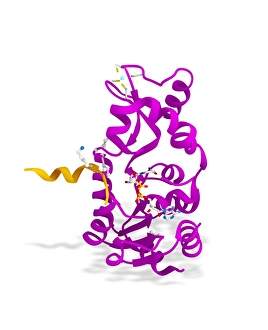
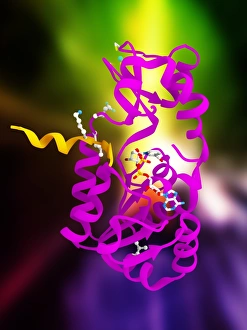
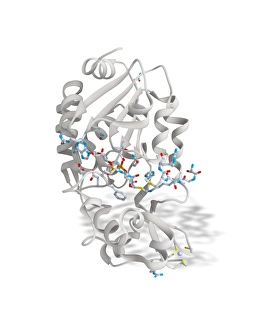
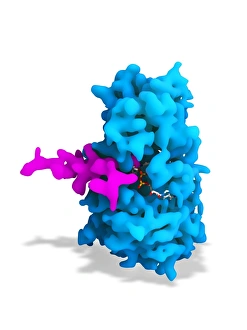
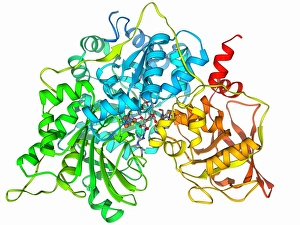
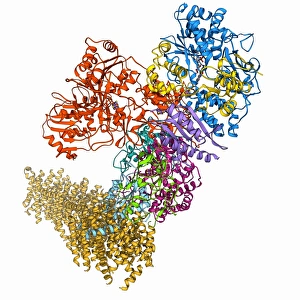
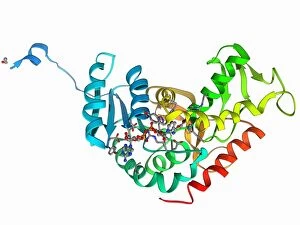
"Unveiling the Mysteries of Metabolism: Exploring the Powerhouses Within" Step into the microscopic world with TEM images revealing the intricate structure of mitochondria, the cellular powerhouses responsible for metabolism. Discover Theodor Schwann, a pioneering German physiologist whose groundbreaking work laid the foundation for our understanding of metabolism. Travel back to the 18th century when kidney stones puzzled scientists and sparked investigations into metabolic disorders. Marvel at artwork C013 / 4675 depicting thyroid anatomy, showcasing its crucial role in regulating metabolism and overall health. Delve deeper into molecular intricacies with an image of cytochrome b5 molecule C015 / 6696, unraveling its contribution to metabolic processes within cells. Witness SEM images capturing thyroid gland capillaries and blood vessels, highlighting their vital role in transporting hormones essential for metabolism regulation. Contemplate creation through a conceptual image that symbolizes how metabolism is at the core of life's energy flow. Explore mitochondria up close with SEM images that showcase their unique structures and emphasize their significance in powering cellular activities. Gain insight into human physiology with a diagram illustrating key organs involved in digestion and metabolism – liver, stomach, gallbladder, and pancreas working harmoniously together. Peer into DNA interactions as TFAM transcription factor bound to DNA C015 / 7059 reveals how genes are regulated to maintain optimal metabolic function within cells. Uncover the intricate relationship between thyroid and pituitary glands – two master regulators orchestrating hormonal balance crucial for proper metabolism control.